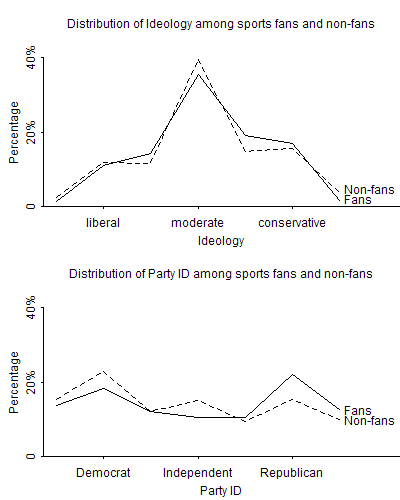
A few months ago, Yu-Sung and I summarized some survey results from the 1993-1996 General Social Survey. 56% of respondents said they attended an amateur or professional sports event” during the past twelve months, and it turned out that they were quite a bit more Republican than other Americans but not much different in their liberal-conservative ideology:
Then, the other day, someone pointed me to this analysis by Reid Wilson of a survey of TV sports watchers:
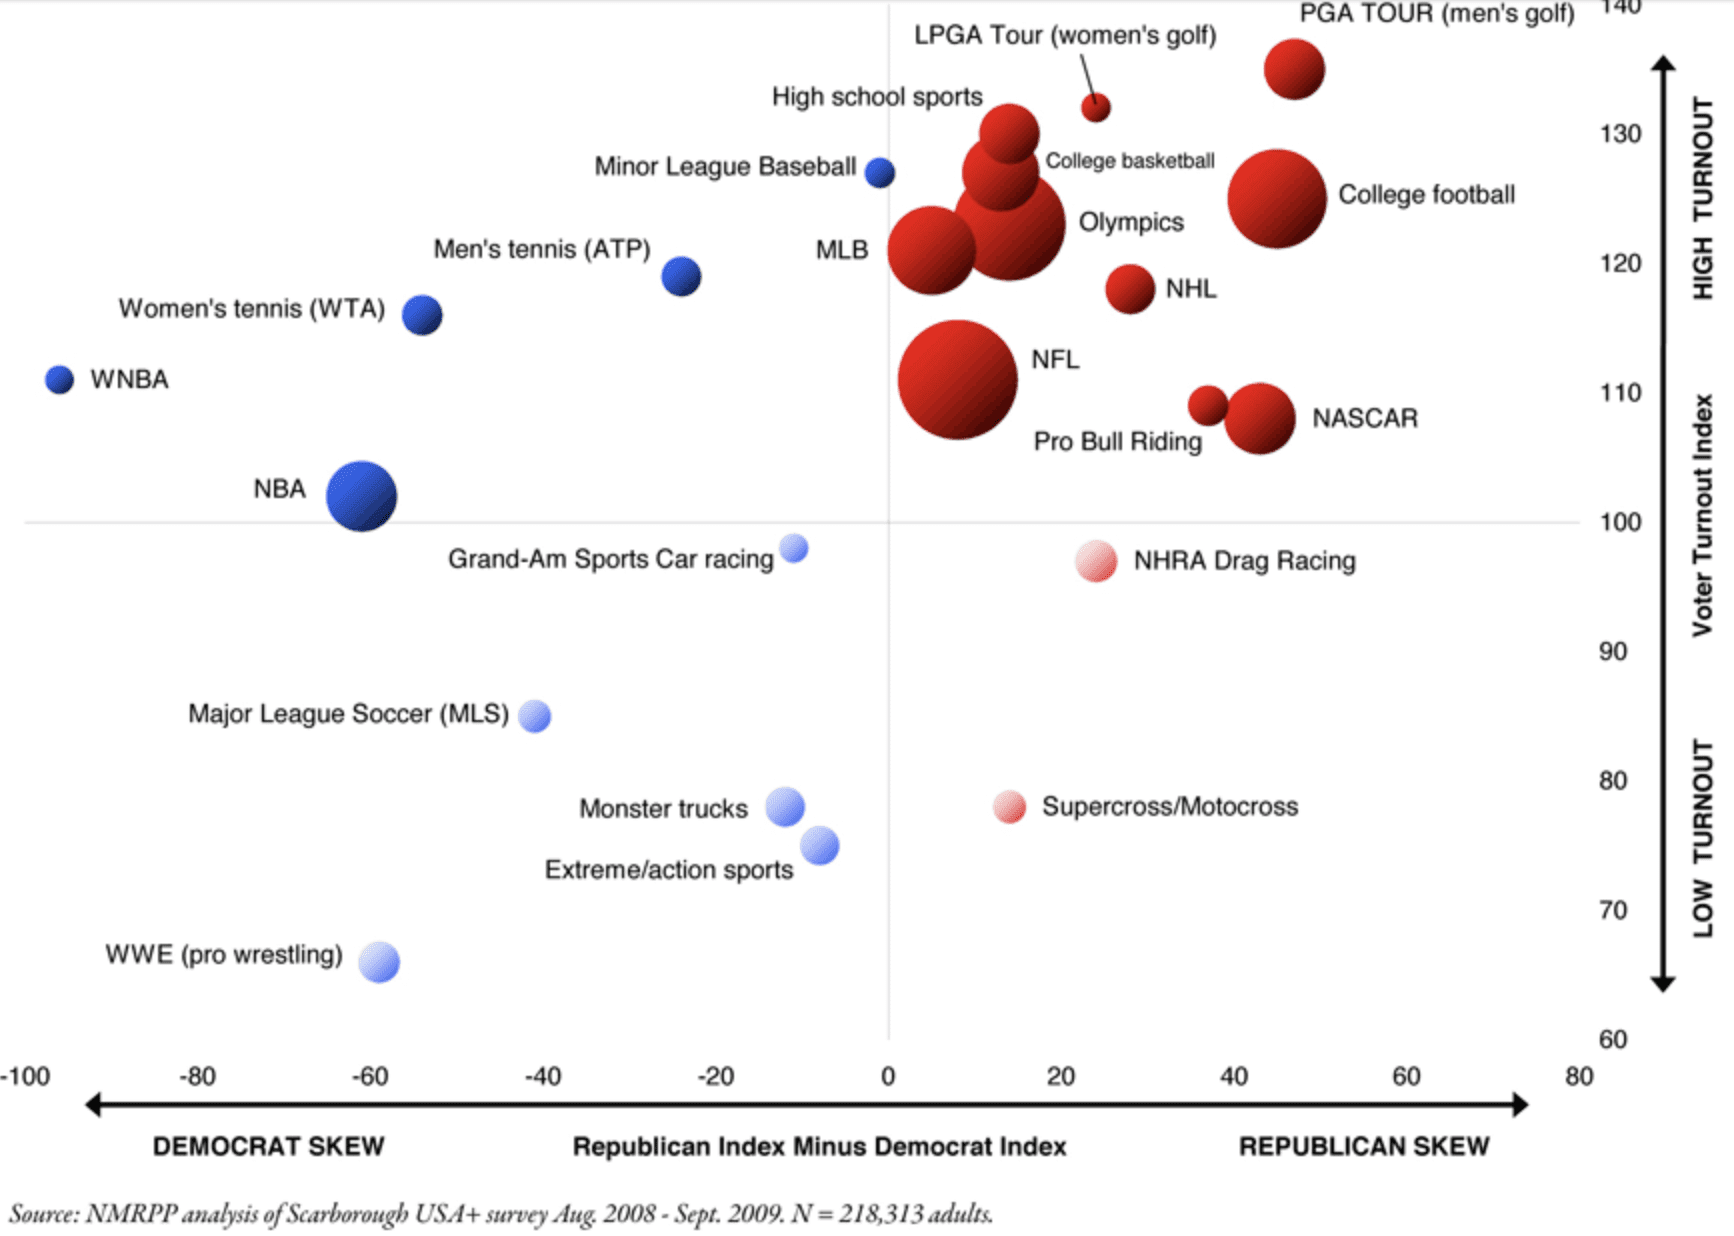
The graph is very well done. In particular, the red and blue coloring (indicating points to the left or right of the zero line) and the light/dark (indicating points above or below the center line on the vertical axis) are good ideas, I think, despite that they convey no additional information, in that they draw attention to key aspects of the data.
Wilson describes the data as “survey results from a total of 218K interviews between Aug. ’08 and Sept. ’09.” So I guess the standard errors are basically zero!
P.S. Wilson does this weird thing where, except in the title of his article and the label of his graph, he never uses the terms Republican and Democrat, instead writing “GOPer” and “Dem.” What’s with that? Has he just been writing political news for so long that he’s tired of typing out the full words? I don’t actually recall ever having seen the term GOPer used before, and it was a bit jarring to me. Otherwise I thought the article was fine.
Probably I'm a bit confused, but I can't see anywhere what the size of the circles reflects. Is it the relative popularity of the different sports?
I wish he had put the colors and saturations on a graduated scale, instead of a step function at the origins.
Also, what's the sizes of the dots? Fraction, I guess? Incidentally, if you're going to shade the dots like they're 3D, wouldn't you need to make the volumes proportional?
Interesting survey analysis by Wilson. It leavesme with a couple of questions: 1) what does the size of the bubbles signify? 2) I'd have expected to see the "major" sports situated in the middle of the spectrum and the minor sports more likely in the extremes (due to sampling variability) but don't see it here. Perhaps it's the gigantic sample size.
Regarding the sample size – this is an expensive survey funded by industry. I always wonder if we are getting a false sense of security (negligible sampling error). One could argue that the sample measures accurately the mindset of the population (who are likely to respond to such surveys) at the time of the survey. But the truth is we all will take this as a general finding, extrapolating both to the past and the future. When doing so, is the error close to zero?
also, to reconcile the two analyses, we'd need to know how they define a "sports fan". Your definition excludes people like me who watch a lot of sports on TV or online but rarely go to live events.
Wilson was just reporting on the study. It was actually put together by Will Feltus and his team at National Media. Relevant links:
http://www.nmrpp.com/sportsfans.html
http://twitter.com/WillFeltus
The size of the bubble is representative of audience size for that particular sporting event.
For some reason I thought Monster trucks and WWE wrestling would be watched more by Republicans.
Excellent.
Nothing too surprising. Golf clearly attracts the most conservative and civic-minded of sports fans.
Spectator sports absorb a sizable fraction of conservative energies in this country, especially college football which diverts a lot of tribal passions away from politics and culture. For example, T. Boone Pickens has donated something like $165 million to the Oklahoma State football team. He could have bought half of all the pundits in the country for that money.
Putting on a professional golf tournament requires a huge amount of labor, most of it volunteers from the local community. The savings are typically given to charities. Golf is the only big sport where charity fundraising is a routine and not insignificant part of the system.