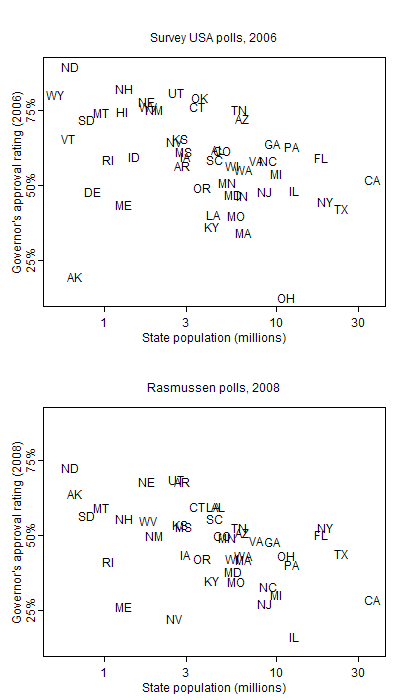
A couple years ago, upon the selection of Sarah Palin as vice-presidential nominee, I made some graphs of the popularity of governors of different-sized states:
As I wrote at the time:
It seems to be easier to maintain high approval in a small state. What’s going on? Some theories: in a large state, there will be more ambitious politicians on the other side, eager to knock off the incumbent governor; small states often have part-time legislatures and thus the governor is involved in less political conflict; small states (notably Alaska) tend to get more funds per capita from the federal government, and it’s easier to be popular when you can disburse more funds; large states tend to be more heterogeneous and so it’s harder to keep all the voters happy.
I was curious how things have been going more recently, and Hanfei made an updated graph using data from this archive. Here’s the story:

There’s lots of variation–clearly there are many other factors than state population that predict governors’ popularity–but we continue to see more the more popular governors in smaller states.
The problem also calls out for some regression analysis to compare for factors other than state size. We haven’t done a lot here, but we did regress governors’ approval on two variables:
– log (state population),
– percent change in average personal income in the state in the past year.
Here’s what we found:
> display (lm (popularity ~ c.log.statepop + c.income.change))
coef.est coef.se
(Intercept) 48.57 2.15
c.log.statepop -6.10 2.26
c.income.change 2.44 1.68
According to these results, governors of large states are still less popular than governors of small states, on average, even after controlling for recent economic performance. (We also tried a regression including the interaction of these two predictors, but I won’t bother showing it: the coefficient of the interaction was small and the other coefficients were essentially unchanged.) It’s possible that we didn’t use the best economic variables, but, for now, I’d say that the evidence is pretty clear that it’s tougher being a governor of a large state.
Good analysis; would be curious to see how that looked if you controlled for the federal funds disbursement (data here, for example: http://www.taxfoundation.org/research/show/22685….
I suspect there is a team effect. In studies they know people will be more forgiving of infractions committed by what they perceive as their own team as opposed to those by other teams. The effect is strong enough that it is measurable, even if you just give out different color wristbands and don't tell them they are on a team, they will still support their own wristband color. In smaller states, I think their may be much more association with a team, and so that politician may be from the wrong party and he may do all the wrong economics, perhaps even a bit of a cheat, but he's on my team and I'll support him.
It would be interesting to factor in racial diversity on top of change in personal income. A quick look at the states with the worst rated governors – NY and CA are also some of the most diverse, likely leading to racial tensions, etc. Likewise, tensions over immigration are high in Nevada and certainly Arizona. Looking at the overall spread some states would not fit within this model, but it would still be interesting if diversity plays any role.
How about using a log2 transform? I think that would make interpretation of the coefficient easier: a doubling of population, yields a 8% drop in popularity.
I wonder if it's an immigration phenomenon. A quick eyeball suggests that the states in the upper left quadrant have very low immigration, both in absolute and relative numbers. Less group threat, and all that.
It's also the case that a lot of the states in the upper left quadrant (AK, ND, WY, MT, NM to some extent) are big oil-producing states, and have done quite well off of oil revenues in the period of your data. Some, but not all, of this will show up in income measures. Granted, CA and TX are big oil states, too, although not on a per capita basis: http://www.statemaster.com/graph/ene_pet_pro_perc…
I think you should probably use the unemployment rate as an economic control rather than (or in addition to) change in average income, as changes in average income can be dominated by a small percent of the overall population.
Just by eyeballing, it seems like the 2009 state unemployment levels match pretty well your 2009 graph… smaller states tend to have lower unemployment, and those states with lower unemployment also seem to be the ones with high governor approval ratings. Again, this is just a quick inspection.
Here's the data: http://www.bls.gov/lau/lastrk09.htm
That's really interesting! Two questions: (1) why isn't Wyoming (WY, I think) on the second and third plots, and (2) what happened in Ohio in 2006?
Cost of land / housing (median home price?). There's less fighting over land in smaller-pop states because of lower demand, so lower prices. The citizens don't know supply and demand, so they credit it to the benevolence or skill of their rulers.
Federal disbursement funds should be per capita. How grateful is the average citizen? Well, depends on how much of the goodies they get. A lavish park or library obtained through federal funds is not the same in a high-pop vs. low-pop state because, again, there is more fighting over it in the former.
That raises the cost to the average citizen to enjoy it — e.g., by having to wait around for hours before it's unoccupied, having to push past and be pushed by lots of people just to get through the area, etc. So the citizens / users will be less grateful for the thing in a high-pop state.
I agree with Nick…to some extent, this may just be capturing the fact that smaller states have lower unemployment and lower crime.