In the context of a discussion of Democratic party strategies, Matthew Yglesias writes:
Given where things stood in January 2009, large House losses were essentially inevitable. The Democratic majority elected in 2008 was totally unsustainable and was doomed by basic regression to the mean.
I’d like to push back on this, if for no other reason than that I didn’t foresee all this back in January 2009.
Regression to the mean is a fine idea, but what’s the “mean” that you’re regressing to? Here’s a graph I made a couple years ago, showing the time series of Democratic vote share in congressional and presidential elections:
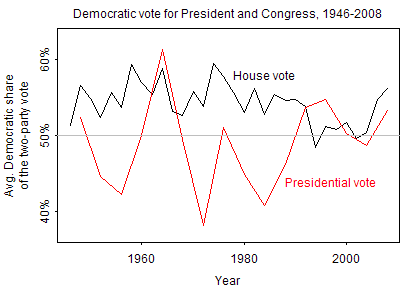
Take a look at the House vote in 2006 and 2008. Is this a blip, just begging to be slammed down in 2010 by a regression to the mean? Or does it represent a return to form, back to the 55% level of support that the Democrats had for most of the previous fifty years? It’s not so obvious what to think–at least, not simply from looking at the graph.
What I’m saying is this. As an ear-to-the-ground political pundit, Yglesias might well have a sense of political trends beyond what I have up here in my ivory tower. (I really mean this; I’m not being sarcastic. I don’t know much about the actual political process or the politicians who participate in it.) And I can well believe that, in January 2009, Yglesias was already pretty sure that the Democrats were heading for electoral trouble. But, if so, I think it’s more than “regression to the mean”; he’d have had to have some additional information giving him a sense of what that mean actually is.
P.S. Yglesias responds:
I [Yglesias] think historically Democrats averaged over 50% of the vote because of weird race dynamics in the South, but nowadays we should expect both parties to average 50% of the vote over the long term.
To which I wrote:
Could be. On the other hand, various pundits have been saying that in future years, the race dynamics of blacks and Latinos will give the Democrats a permanent advantage. And in many ways it seems gravity-defying for the Republicans to be at 50% with such conservative economic policies.
In any case, you may be right. I just have to admit it’s not something that I saw as of Jan 2009. As a matter of fact, I clearly remember looking at that graph I made in Nov 2008 and trying to decide whether it represented an exciting new trend, an anti-Bush blip, or a reversion to the pre-1994 pattern of 55%/45% voting. At the time, I decided I had no idea.
Yglesias then shot back with:
Well then let me go on record now then as hypothesizing that the long-run 1994- trend will average 50/50.
I like that you posted this. Folks write about "regression to the mean" when they talk about crime trends, too, and I'm never sure how they know what the proper "mean crime rate" is.
I think you've graphed the measure.
I think he was talking about seats in congress.
Why on earth should we "expect both parties to average 50% of the vote over the long term?" We don't expect the Libertarian party, say, or the Green party to get 50% of the vote. I don't see any fundamental reason why the parties should get equal support. Maybe you could make a case that the two parties are each striving for popularity and have roughly equal resources with which to do so, and hence tend to be neck and neck, but I think such a case would require a lot of defending. Maybe I'm missing something in Yglesias' claim?