Uberbloggers Andrew Sullivan and Matthew Yglesias were kind enough to link to my five-year-old post with graphs from Red State Blue State on time trends of average income by state.
Here are the graphs:
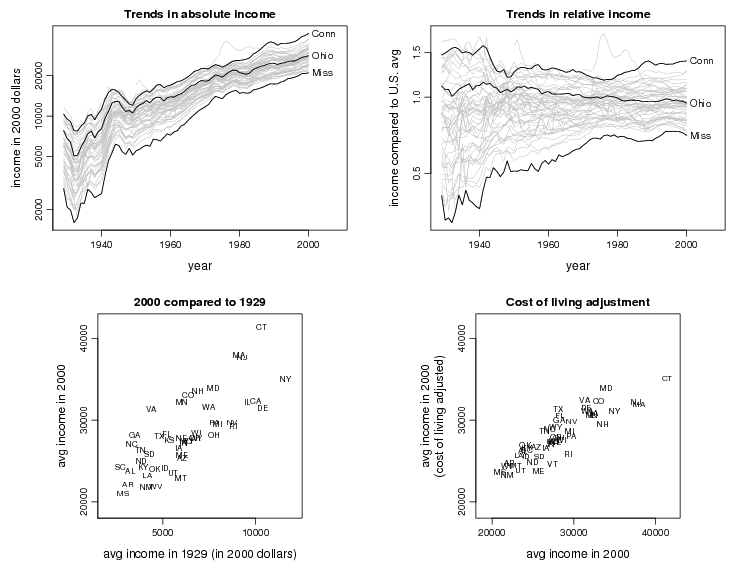
Yglesias’s take-home point:
There isn’t that much change over time in states’ economic well-being. All things considered the best predictor of how rich a state was in 2000 was simply how rich it was in 1929…. Massachusetts and Connecticut have always been rich and Arkansas and Mississippi have always been poor.
I’d like to point to a different feature of the graphs, which is that, although the rankings of the states haven’t changed much (as can be seen from the “2000 compared to 1929” scale), the relative values of the incomes have converged quite a bit—at least, they converged from about 1930 to 1980 before hitting some level of stability. And the rankings have changed a bit. My impression (without checking the numbers) is that New York and Connecticut were historically industrial but Connecticut is now much more suburban.
I think one reason NY is not so rich is that, as a rich state, it’s been heavily taxed for about 100 years in order to pay for improvements in the rest of the country. Remember “Good Roads Everywhere”?

From 1924:
“Such a system of National Highways will be paid for out of general taxation. The 9 rich densely populated northeastern States will pay over 50 per cent of the cost. They can afford to, as they will gain the most. Over 40 per cent will be paid for by the great wealthy cities of the Nation. . . . The farming regions of the West, Mississippi Valley, Southwest and South will pay less than 10 per cent of the cost and get 90 per cent of the mileage.”
It would be awesome to see who’s contributing to and who’s benefiting from government – and where there’s imbalance. States are perhaps the easiest way to break down the contributions/benefits – there are many others.
Aleks:
Also, the political angle is interesting. People on the right who dislike income redistribution in general, tend to be happy to take money from cities and spend that money in the countryside, and they will even justify it by saying that cities are full of rich people. Meanwhile, people on the left tend support redistribution at the individual level but get annoyed that states with big urban areas are paying out more than their share of taxes.
This is related to Jonathan Rodden’s observation that, around the world, cities tend to be richer and politically on the left. So there is an inherent tension around the idea of income redistribution.
Pablo Beramendi has a new book out that addresses this issue in detail (The Political Geography of Inequality, Cambridge UP).
I think it’s more being annoyed by the hypocrisy of people in the poor, generally red states railing against the federal government, high taxes, etc., while simultaneously being happy to receive more than their proportionate share of the goodies that the federal government collects in taxes. For example, Rick Perry (governor of Texas) was happy to collect a pile of stimulus money from the feds that was supposed to have been used for education, and then used it to reduce his deficit instead of keeping public school teachers employed. That kind of hypocrisy.
I’ve been fascinated by region-level wealth visualizations of Europe: http://epp.eurostat.ec.europa.eu/statistics_explained/index.php/GDP_at_regional_level Paris seems to suck out all the air out of France, whereas other countries seem less centralized. It could be an artifact of the annoying discretization (see color continuum) – but my main point is that we have computers and models that would allow us to analyze data at much more granular levels.
New York seccession now!
I’d guess Andrew knows this, but maybe not all readers.
See Federal Taxes Paid vs Federal Spending per State.
2005 for a few interesting states
State Net Ratio
CA -#47B $.78 biggest state => Federal govt transfer
CT -$10B $.69
MD +$16B $1.30
NJ -$27M $.61 worst ratio
NY -$24B $.79
VA +$35B $1.51 biggest Federal => state
The Tea Party is strong in VA, loudly demanding smaller government. VA does coastal planning while disallowing the phrase “sea level rise” although “intermittent coastal flooding” is OK. Naturally, as the damage increases from something they say does not exist, other states will pay, such as for Norfolk.
this also says that in the NY secession, we should take CT and NJ with us (and maybe leave behind the “Niagara” part of the state).
Hey, don’t leave us Vermonters out, else we may have to become Canadian!
And Wall Street has been redistributing wealth to itself from the rest of the country for just as long.
Steve:
Indeed, one of the arguments in favor of government redistribution (at the individual or regional level) is that it counteracts redistribution that has occurred in the private sector.
As for taking CT, people might want to see <a href="http://en.wikipedia.org/wiki/The_Nine_Nations_of_North_America Nine Nations of North America. He thought most of CT was part of new England, except where the Red Sox fans ended. It might be hard to disentangle NY.
One might note that it’s unclear that when setting up the Senate, the Founders could have anticipated the current disparities of state populations.
What is missing from this discussion is a stacked pair-of-histograms (or other better graphic) showing the per capita expenditure/tax ratio for states which voted democrat (contrasted with republican) for each presidential election since 1980, and something similar for US Senate and House of Representatives. The tables I have seen for a few select years suggest that whether a state is a net recipient of federal funds or a net donor almost completely determines which party it supports, with states which are net recipients almost all supporting the anti-big-government republican party.
A model might also be interesting, but probably unnecessary if the histograms for the two parties overlap very little…