Etienne LeBel writes:
You’ve probably already seen it, but I thought you could have a lot of fun with this one!!
The article, with the admirably clear title given above, is by James McNulty, Michael Olson, Andrea Meltzer, Matthew Shaffer, and begins as follows:
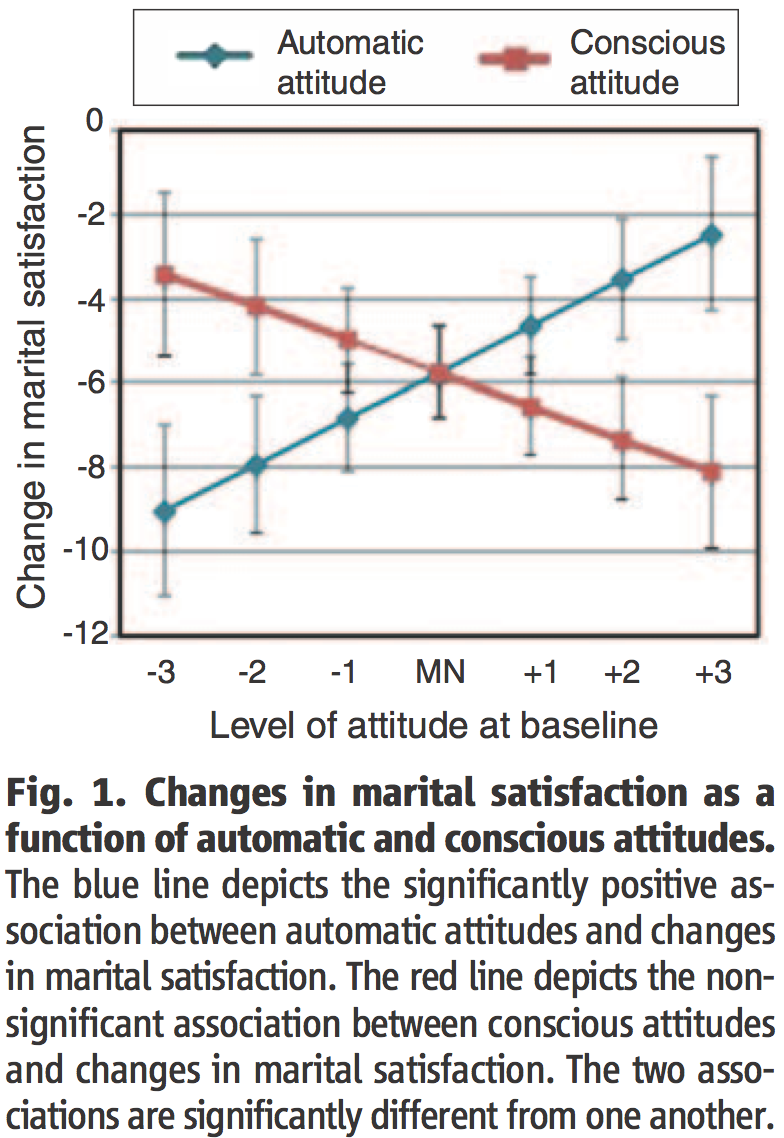
For decades, social psychological theories have posited that the automatic processes captured by implicit measures have implications for social outcomes. Yet few studies have demonstrated any long-term implications of automatic processes, and some scholars have begun to question the relevance and even the validity of these theories. At baseline of our longitudinal study, 135 newlywed couples (270 individuals) completed an explicit measure of their conscious attitudes toward their relationship and an implicit measure of their automatic attitudes toward their partner. They then reported their marital satisfaction every 6 months for the next 4 years. We found no correlation between spouses’ automatic and conscious attitudes, which suggests that spouses were unaware of their automatic attitudes. Further, spouses’ automatic attitudes, not their conscious ones, predicted changes in their marital satisfaction, such that spouses with more positive automatic attitudes were less likely to experience declines in marital satisfaction over time.
The graph is shown above, and it leads me to a number of questions:
1. This is not a plot of the data. The dots and error bars are misleading as they would seem to imply independent data points, but they’re clearly just points on the regression lines. Better would be to actually plot the data.
2. I don’t want to predict changes in marital satisfaction, I want to predict actual satisfaction. And I suspect the authors of this paper feel the same way. Note the title of the paper: it’s “whether their marriage will be satisfying,” not “how much their satisfaction level will change.”
3. The negative slope for conscious attitude is no surprise, it’s your basic regression-to-the-mean story. Hence I’m not so impressed by the difference between the slopes between automatic and conscious attitudes, as the slope for the latter is corrupted by that artifact.
4. The authors write, “spouses’ reports of their conscious attitudes were not correlated with their automatic attitudes,” and they seem to think this is a good thing. But, to me, it seems weird. You wouldn’t want the two measures to be 100% correlated—then the automatic attitudes would be providing no information at all—but a zero correlation makes me suspicious. Shouldn’t they be positively correlated, at least a little?
5. The potential researcher degrees of freedom here are huge. As is often the case in this sort of study, many of the particular analyses presented in the paper seem reasonable enough, but there are lots and lots of other, similar analyses that would have made just as much sense. Also, various comparisons of significant vs. non-significant, for example this:
Although automatic attitudes directly predicted changes in marital satisfaction over the first seven waves of the study [B = 0.19, SE = 0.08, t(250) = 2.36, P = 0.019; effect size r = 0.15], these reports of marital satisfaction did not predict subsequent perceptions of problems [B = 0.01, SE = 0.01, t(133) = 1.41, n.s.; effect size r = 0.12], and thus the indirect effect (B = 0.002) was not significant [95% CI, (–0.001, 0.006)].
This is a lot to be extracting from a change in z-score from 2.4 to 1.4, especially given that the cut point (“the first seven waves”) seems somewhat arbitrary.
As usual, let me emphasize that I’m not saying that the researchers’ claims are wrong, just that the evidence they present is not as clear as they imply (for example, “Our findings demonstrate not only the validity of automatic processes as a theoretical construct, but also their practical importance.”)
Finally, in response to my correspondent’s very first remark: No, criticizing this sort of study is not fun for me! Part of me wishes I could just go back to my old hobby of mocking bad graphs.
P.S. Sad to say, this study seems to have attracted a bunch of credulous press reports, for example this one from Carey Goldberg, which amusingly quoted someone from the Gottman Institute “for a reality check.” Hmmm . . . where have we heard that name before?
Could you clarify point 3, “The negative slope for conscious attitude is no surprise, it’s your basic regression-to-the-mean story. Hence I’m not so impressed by the difference between the slopes between automatic and conscious attitudes, as the slope for the latter is corrupted by that artifact.”? How does reg to mean explain the conscious attitude change specifically?
It’s a weird graph, but you could interpret the red line as saying basically that people who started with a low satisfaction (on the left) didn’t decline as much as people who started with a high satisfaction. In other words, after an initial transient, everyone tends towards some central level of satisfaction (on this scale about -6 to -5).
In contrast, the automatic responses show an increased spread after time. people who started at -3 went to about -12 and those at +3 went to about 0.
If the change score is constructed t7 – t1, and if conscious attitudes at t1 positively predict t1 satisfaction, then there will be a negative correlation between change and conscious attitudes (red will go down). This would hold even if t7 and t1 satisfaction are uncorrelated. But t7 and t1 will likely be correlated if only because of scale effects (i.e. from a high satisfaction score, you can only go down). So there are multiple reasons for an induced correlation with change, and some strange associations can be induced depending on the measure of change.
Of course the ascending blue line is the main finding. I think Andrew is saying that the relative difference between the blue and red lines is impacted because red almost has to be descending. However, if the blue positive association stands on its own (as the caption says), then that may be of interest.
In general I’m positively disposed to these kinds of implicit attitude findings. I haven’t read the article though, and there are many issues to consider – including greater measurement error for the implicit attitudes as compared with the conscious ones, construct definition for interpreting the difference in reaction times, construct definition for the person to person differences in reaction times etc. The graph is a bit misleading because it seems to standardize the implicit and explicit measures when they will have very different ranges and distributional shapes, and the sample midpoint of each measure could have very different meanings. (For instance, the midpoint for explicit attitudes could be 4 on a 5 point scale, whereas the midpoint for the implicit could be indifference, or even a negative bias. The details would presumably be in the materials somewhere.)
FWIW this example doesn’t look transparently problematic like the claims of huge birth sex-ratio swings based on attractiveness, or the implausibly large estimates of changes in dressing and voting behavior according to fertility status.
“We found no correlation between spouses’ automatic and conscious attitudes, which suggests that spouses were unaware of their automatic attitudes”
Or perhaps “automatic attitudes” aren’t attitudes and therefore, this conclusion is unfathomably bland.
Pingback: Though Many Social Psychologists May Be Unaware, Multiple Testing Often Leads to Multiple Spurious Conclusions | Musings on Using and Misusing Statistics