Andrei Lopatenko writes:
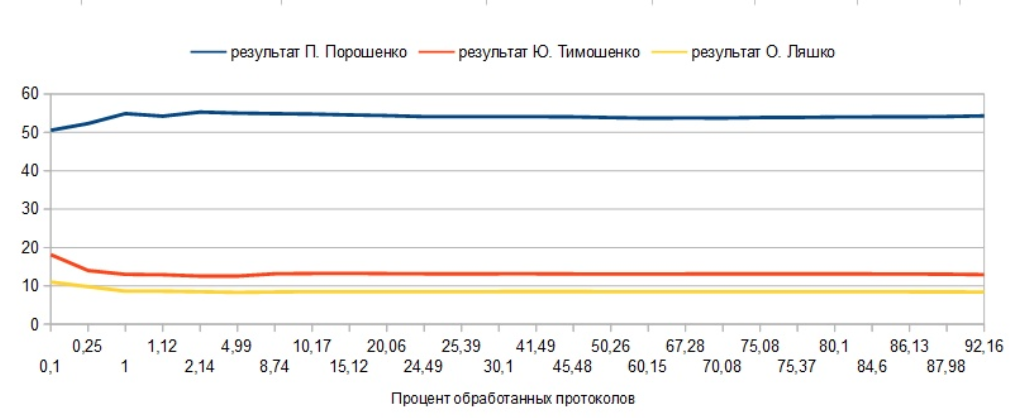
The top chart here represents the number of votes per a candidate as a function of the number of total bulletins counted.
X is the total percentage of votes counted (5% means 5% of the total number of bulletins is read).
Y is the percentage of votes per candidate blue Poroshenko, red Timoshenko, yellow Lyashko.
Does this chart seems natural to you as elections would not be influenced by any means?
Bulletins counts entered in batches from election station (there should be around 30000 of them in Ukraine).
I replied that I do not know but it does make sense that the proportions will become more stable as the number of votes increases. Oddly enough, this is a problem I’ve studied before.
Or, as Chris Hedges might say, Как с точки зрения статанализа может получиться такое: на протяжении почти всего подсчета протоколов результаты 3-х основных кандидатов меняются в пределах нескольких сотых процента.
Prof. Gelman, I am glad you are now inserting Russian text in your posts, but isn’t it a bit discriminatory for most of your readers?
Google translate is your friend:
https://translate.google.com/#auto/en/%D0%9A%D0%B0%D0%BA%20%D1%81%20%D1%82%D0%BE%D1%87%D0%BA%D0%B8%20%D0%B7%D1%80%D0%B5%D0%BD%D0%B8%D1%8F%20%D1%81%D1%82%D0%B0%D1%82%D0%B0%D0%BD%D0%B0%D0%BB%D0%B8%D0%B7%D0%B0%20%D0%BC%D0%BE%D0%B6%D0%B5%D1%82%20%D0%BF%D0%BE%D0%BB%D1%83%D1%87%D0%B8%D1%82%D1%8C%D1%81%D1%8F%20%D1%82%D0%B0%D0%BA%D0%BE%D0%B5%3A%20%D0%BD%D0%B0%20%D0%BF%D1%80%D0%BE%D1%82%D1%8F%D0%B6%D0%B5%D0%BD%D0%B8%D0%B8%20%D0%BF%D0%BE%D1%87%D1%82%D0%B8%20%D0%B2%D1%81%D0%B5%D0%B3%D0%BE%20%D0%BF%D0%BE%D0%B4%D1%81%D1%87%D0%B5%D1%82%D0%B0%20%D0%BF%D1%80%D0%BE%D1%82%D0%BE%D0%BA%D0%BE%D0%BB%D0%BE%D0%B2%20%D1%80%D0%B5%D0%B7%D1%83%D0%BB%D1%8C%D1%82%D0%B0%D1%82%D1%8B%203%D1%85%20%D0%BE%D1%81%D0%BD%D0%BE%D0%B2%D0%BD%D1%8B%D1%85%20%D0%BA%D0%B0%D0%BD%D0%B4%D0%B8%D0%B4%D0%B0%D1%82%D0%BE%D0%B2%20%D0%BC%D0%B5%D0%BD%D1%8F%D1%8E%D1%82%D1%81%D1%8F%20%D0%B2%20%D0%BF%D1%80%D0%B5%D0%B4%D0%B5%D0%BB%D0%B0%D1%85%20%D0%BD%D0%B5%D1%81%D0%BA%D0%BE%D0%BB%D1%8C%D0%BA%D0%B8%D1%85%20%D1%81%D0%BE%D1%82%D1%8B%D1%85%20%D0%BF%D1%80%D0%BE%D1%86%D0%B5%D0%BD%D1%82%D0%B0.