Rachel Cunliffe shares this delight:
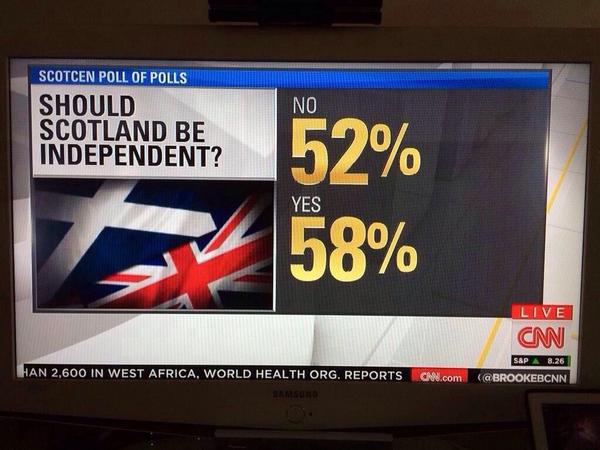
Had the CNN team used an integrated statistical analysis and display system such as R Markdown, nobody would’ve needed to type in the numbers by hand, and the above embarrassment never would’ve occurred.
And CNN should be embarrassed about this: it’s much worse than a simple typo, as it indicates they don’t have control over their data. Just like those Rasmussen pollsters whose numbers add up to 108%. I sure wouldn’t hire them to do a poll for me!
I was going to follow this up by saying that Carmen Reinhart and Kenneth Rogoff and Richard Tol should learn about R Markdown—but maybe that sort of software would not be so useful to them. Without the possibility of transposing or losing entire columns of numbers, they might have a lot more difficulty finding attention-grabbing claims to publish.
Ummm . . . I better clarify this. I’m not saying that Reinhart, Rogoff, and Tol did their data errors on purpose. What I’m saying is that their cut-and-paste style of data processing enabled them to make errors which resulted in dramatic claims which were published in leading journals of economics. Had they done smooth analyses of the R Markdown variety (actually, I don’t know if R Markdown was available back in 2009 or whenever they all did their work, but you get my drift), it wouldn’t have been so easy for them to get such strong results, and maybe they would’ve been a bit less certain about their claims, which in turn would’ve been a bit less publishable.
To put it another way, sloppy data handling gives researchers yet another “degree of freedom” (to use Uri Simonsohn’s term) and biases claims to be more dramatic. Think about it. There are three options:
1. If you make no data errors, fine.
2. If you make an inadvertent data error that works against your favored hypothesis, you look at the data more carefully and you find the error, going back to the correct dataset.
3. But if you make an inadvertent data error that supports your favored hypothesis (as happened to Reinhart, Rogoff, and Tol), you have no particular motivation to check, and you just go for it.
Put these together and you get a systematic bias in favor of your hypothesis.
Science is degraded by looseness in data handling, just as it is degraded by looseness in thinking. This is one reason that I agree with Dean Baker that the Excel spreadsheet error was worth talking about and was indeed part of the bigger picture.
Reproducible research is higher-quality research.
P.S. Some commenters write that, even with Markdown or some sort of integrated data-analysis and presentation program, data errors can still arise. Sure. I’ll agree with that. But I think the three errors discussed above are all examples of cases where an interruption in the data flow caused the problem, with the clearest example being the CNN poll, where, I can only assume, the numbers were calculated using one computer program, then someone read the numbers off a screen or a sheet of paper and typed them into another computer program to create the display. This would not have happened using an integrated environment.
I think your list of three options is too simplistic. Most serious researchers are not that silly. I don’t think there’s a bias of the sort you mention. I bet there’s even more errors where data that actually supported your hypothesis got thrown away because of a silly error.
e.g. I’ve gotten into this paranoid habit of checking and double checking and triple checking data every time the results turn out to be “good” (i.e. this chemical reaction works fantastically well) so that I might be able to present them to my boss, meeting, conference etc.
OTOH lackluster results (e.g. this catalyst is a dud) I discard without too much worry. Because no one is going to critically examine my notebook of things that did not work.
Maybe this is a response to having a very nitpicky PhD advisor who’d get raving mad at the slightest typo or error. OTOH, I don’t think I’m unusual. Most serious researchers I’ve seen are extremely careful to not get themselves embarrassed by seemingly sensational results that later turn out to be duds.
Yes, mistakes still happen. But I don’t think there’s any systematic bias of the sort you mention.
This is just speculation, but my intuition is Andrew’s systematic bias may be more present in softer subjects, such as economics, per his examples. My reasoning is as follows:
1. Andrew’s description makes a lot more sense regarding soft subjects, because such subjects are more ideologically charged.
2. Replication is much rarer, and frequently impossible in such subjects. If you publish about a surprisingly great chemical reaction, you better hope someone can replicate it.
Rahul:
No one really knows, because science projects are seldom adequately managed – which necessarily requires some auditing.
But, with the exception of a few very careful researchers or directors who did manage their research fellows/staff that I have worked with, Andrew’s description fits perfectly. Keith Baggerly at MD Anderson provided numerous examples he is aware of at SAMSI last week.
One that was _fast tracked_ into the NEJM is publicly documented, given the authors were required by law to submit their data, is given below.
“there was an unusually large number of reclassifications of outcomes from the originally reported data, with a large (approximately 75%) change rate in primary outcome. Reclassifications were in opposite directions for Trasylol® versus Tranexamic Acid and Epsilon Aminocaproic Acid, favouring the latter, and these changes increase through the duration of the study. This observation was never satisfactorily explained.”
http://www.hc-sc.gc.ca/dhp-mps/medeff/advise-consult/eap-gce_trasylol/final_rep-rap-eng.php
Rahul:
You say “most serious researchers are not that silly.” Richard Tol gets a lot of citations but maybe it’s fair to not call him a serious researchers. But Carmen Reinhart and Kenneth Rogoff are generally considered serious researchers, and they made the mistake you’re talking about.
A systematic bias is not hard to come by. All you need is an error process in which errors in one direction (those that support the researchers’ story) are less likely to be caught than errors in the other direction (those that contradict the researchers’ story). Tol’s data errors are an extreme but instructive example.
I disagree. I think you are wrong about the direction error process.
Even with an error process that actually catches more errors in the direction that supports the researcher’s story you will still inevitably see *some* errors in that direction pass undetected.
That’s what happened with Reinhart and Rogoff.
In other words, how do we know that there weren’t Excel errors of the other direction that then were never used by them just because the conclusions were uninteresting.
We don’t know.
Errors in both directions certainly occur. But, as Andrew suggests and I am sure is true, errors that lead to “unexpected” results are more likely to be caught than those that lead to “expected” results, where expected and unexpected refer to the researcher’s state of mind.
I think what “expected” and “unexpected” means isn’t obvious.
In chemistry you are looking for that one elusive catalyst that gets you a great reaction. You try hundreds that don’t work and then one finally does. Is the not-working part “expected” or “unexpected”?
I wager a chemist is far more likely to verify and reverify and re-re-verify his star find than all those hundred compositions that he discarded.
What does that say about the direction of the more likely error?
If a large signal is found above the noise (unexpected), through whatever means, in data that one presumes to be noise alone (expected), one is going to hunt down the origin of that discrepancy till its nailed to a tree. If an experiment just returns noise, the analysis may still not be working, but because it matches expectations, there is likely to be no further digging. Are we not just describing the file-drawer effect or something analogous?
In this context, which I believe is pretty common on this blog, the meanings of expected and unexpected are pretty plain.
The description of your protocol amounts to a blind search for a significant reaction using a myriad of catalysts with no clearly delineated expectation for any of them. Do you expect all of them to not react? How many times do you test each catalyst before rejecting it?
The point has already been made that Gelman is more talking about social sciences (I refuse to call them ‘soft’), where the expected outcome is driven by a lot of human factors, and testing is very difficult to do.
For a chemist to run an experiment requires getting the correct chemicals and lab equipment then go for it. A psychologist, economist or other social scientist has to recruit people in an arduous process, ensuring that each sign an ethics form, are from the correct population, etc. (this gives rise to the dodgy methods described by Gelman a couple of days ago using mass email spamming to recruit people). My point is that running lots and lots of experiments to confirm and validate your first results is simply not an option.
The different definitions of ‘expected outcome’ and the different effort required to run an experiment in natural (excluding biology) and social sciences is what is driving this disagreement. You will happily rerun experiments to confirm your star finding if it is relatively easy – if it’s taken three years to run one experiment you might be a bit less willing to, and thereby fall victim to the type of confirmational bias that Gelman describes.
The issue isn’t really about what the researcher supports; it’s about what the researcher *expects*. Very simply, errors which make analysis results closer to one’s prior expectation (relative to the results of an error-free analysis) are less likely to raise flags and get checked and caught.
“Had the CNN team used an integrated statistical analysis and display system such as R Markdown, nobody would’ve needed to type in the numbers by hand, and the above embarrassment never would’ve occurred.”
I’m betting that Andrew has not used a Markdown scheme for data analysis for a very long time. The only antidote to error-free code is careful rechecking and refactoring after you have done your messy and exploratory coding. Preferably followed up by a check by a second person. You can (of course) make serious errors even if you use Sweave, all that has to happen is some stupid mistake like dividing or multiplying some variable by the wrong variable. What’s worse, it’s damn hard to make ensure that code you wrote in Sweave in 2008 is going to work in 2014. I’m a great fan of reproducible research, I have been posting every analysis I can online after I publish it, and I am a dedicated user of Sweave, right from the time that Sweave came into being. I still make mistakes, and I’d be surprised if other Sweave users would agree with Andrew that Markdown is the cure for all error-problems of the type Andrew is talking about.
“To put it another way, sloppy data handling gives researchers yet another “degree of freedom” (to use Uri Simonsohn’s term) and biases claims to be more dramatic. Think about it.
Love it! What a clever way to frame the problem.”
Observer
P.S. Why cannot I preview comments? ISTR that that capability used to exist?
I don’t agree with the point about how if the guy used R Markdown, this wouldn’t happen. HOWEVER….
I think the general point of the article shouldn’t be that R solves your problems, but that someone who knows HOW to use a statistical programming language, on average, is probably much more able to identify errors like this. Just doing real data work eventually begins to make you very aware of the pitfalls of data, how outliers can drastically change results, and how unclean data can screw up your results. He can code something very easily that will say “if this percentage adds up to more than 100%, error me”. Not saying you can’t do that in Excel, but on average, those who use Excel do so to simply view things, maybe do some quick calculations. They don’t know how to do IF(xxx,1,IF(xx.. etc etc., mostly because their job requirement just said “Know how to use Excel to do simple calculations”
I think what is more important is that “knowing how to use Excel” shouldn’t be a job requirement anymore for work like the above. And we definitely shouldn’t teach statistics students how to only run regressions using clean CSVs, because most data is not clean. We should teach them, most of all, about the INTEGRITY of data and results.
+1. Some of the (very few) Excel power users I’ve met (someone who’s using at least IF, vlookup, etc. ) handle data far more carefully than some of the R & Matlab novices I’ve worked with. e.g. One hack that lessens the risk of using a partially correct formula on a column is to always code things as matrix formulae with Ctrl+Shift+Enter.
In general, Andrew’s prescription seems too simplistic. I don’t think there’s any one magic prescription or tool at all. Perennial diligence, many levels of cross-checks and validation & redundancy bordering on paranoia is the only reasonable cure I can think of.
“many levels of cross-checks and validation & redundancy”
This I certainly agree with. For some reason I am pretty good at creating bugs in my code, and I have found one of the best treatments is to plot absolutely every outcome that my model can produce for which I might have some kind of prior estimate (empirical or otherwise).
Do you have these plots automated as unit tests, so you can just be sure that the code is working as it should?
Yes, though I find it can be just as useful for revealing problems with the model, even if properly coded (I think this is basically Andrew’s posterior predictive checks).
Fully agree. I try to do as much as I can via scripts now, but I used Excel for my very first job in science, doing data entry for a beloved mentor. And he had set up these worksheets with a few simple tricks to detect data entry errors — double entry and conditional formatting, mostly. It was a really fantastic introduction to being careful with data. I certainly appreciate that not everyone’s use of Excel is similar, and that there are more reliable paths to getting it right.
(I think RMarkdown is great in principle, I just wish it were less fiddly. Farting around with tables ate most of my work week this week, and the document still doesn’t look right. Oh well. It still does an amazing lot.)
I’ve only casually dabbled with R-Markdown. But my problem is this: The structure of my report and supporting text is usually so hugely different depending on the exact nature of the numbers.
So I find it terribly hard to imagine me typing a generic report into which the numbers just smoothly tie in at compile time.
Do you face this problem?
Hm, I can see where I *would* but I’ve been trying to learn RMarkdown in a context where that isn’t really a problem — generating canned monthly reports for a very particular collaborator.
For one-off projects, I’m still doing things the old-fashioned way, running my scripts and writing up the results separately. So I could definitely be making errors vulnerable to mockery, if more than one person ever read these reports… I think the idea, though, isn’t usually to use the same report text every time, so much as it is to start your drafts there so that you can update the analyses and text with ease (because I never ever get to write up methods and results in one sitting and have that be the end of it) and so that going back and retracing your steps is easy. Best line from a lecture in my whole stats program– “your closest collaborator is you six months ago but you don’t reply to email.”
I have to agree with the other commenters here, errors can and will slip in whatever platform you use. Checking and rechecking is the only way to prevent these errors. Software isn’t going to save you.
I have to share a very stupid error I caught this morning in my own code. I was coding location from some survey data using an R package (simplification of the actual code here but the principle is the same)
location <- ip.code(survey$ip.address)
survey <- survey[location$region=="North", ]
Looks harmless but as it turns out the ip.code function drops any IP addresses it cannot find (this behavior is sadly not documented in its help file) which turned out to be two thirds of them. Therefore the subset command was essentially meaningless and just recycled the logical vector. I eventually caught the error when the regional summary statistics were just too similar to the overall statistics and I went back to look more closely at the IP coding.
Just thought it was a good example of an insidious error that can occur even when using an uninterrupted data flow. Now obviously there are tests that can be written for each step of this but it's always possible for errors to slip into a workflow.
Jon:
Errors can always slip in, but it makes sense for us to organize our workflow to lower the rate of errors and make it easier for those errors to be detected. No data-handling system is perfect but they’re not all the same. “Software isn’t going to save you” but it could help or it could hurt.
100% agree and I use R for everything and knitr with any co-authors who are willing.
Nevertheless I think there are two varieties of help or hurt that are good to distinguish. knitr and R are helpful for conscientious researchers to error and consistency check more efficiently (and perhaps effectively). However, for people who are less conscientious (or more time pressed), it probably adds very little because its value is in making it easier to go back and check your work. If you’re a researcher who doesn’t bother to do that in the first place, then having a better system won’t make you catch more errors. If Reinhart and Rogoff had gone back and checked their working carefully, then they probably would have caught their errors.
Excel use is a warning sign because it signals that the researcher isn’t bothered about how annoying it is to do error and consistency checking in excel. If Reinhart and Rogoff were in the habit of doing checks on their work, then they probably would have switched to an easier tool for doing that.
But the corollary of this is that the causation is backwards. If you made Reinhart and Rogoff or CNN switch to knitr it wouldn’t make them become conscientious data users. If they were conscientious data users, they would naturally want to switch to a platform that makes good research practices more efficient anyway.
The possibility of errors slipping into code brings up the important issue of version control. And with a build & test system, one can verify that even though the code-base may be forever shifting, core programs are still producing the *correct* results given standardized inputs. So yeah, “software isn’t going to save you,” but it should give you some confidence that the code is working properly.
I agree; I, too, frequently run into this sort of problem.
I think many of R’s defaults are useful but there are some I don’t like and some default behaviors I would like to be able to turn off situationally. In general I would like vector recycling to NOT occur by default. I like the default that if a variable isn’t defined within a function, the global value is used if the variable exists globally, but I would like to be able to turn that behavior off. Those are my two biggies, as far as issues that have caused me heartache, but there are others. And, as Jon M says, errors can slip in whatever platform you use, including the hypothetical platform that would exist if R were changed to suit my desires.
I wonder if anyone has put together a list of R “best practices,” I could probably learn a lot. I have an informal list of such practices that I use myself — like, avoid referring to rows and columns by number, always refer to them by name instead — but there are probably other simple things I could do that would save me time and reduce the risk of errors.
My biggest bugbear is the stringsAsFactors=TRUE default. It makes sense occasionally, but all too often it can lead to really odd situations with merging etc.
Why would you assume whatever software they use to put text up on screen could be programmatically hooked up to R?
Alex:
I was kidding about R. The point is that a continuous flow is better than having to read numbers off one file and type them into another.
Ok, now that’s a much better prescription than selling R Markdown as the cure-all. That advice harks back to the age old Unix practice of using pipes & scripting languages to glue together diverse tools.
Unfortunately, Software designed for Windows tends to be a bit ugly about allowing continuous flow sometimes. Not impossible but harder.
A fundamental problem is that social science remains a craft where experts use advanced tools to manufacture scientific inferences.
Crafts involve little in the way of abstraction, automation, and specialization, resulting in very high error rates (in comparison to say manufacturing), and gross inefficiency (really, does a scientist have to type set, spell check, and write well, or is that better outsourced to people in the English department?). I think a better approach is to adopt a Hollywood model with directors, producers, script writers, actors (units), etc… Some labs do this but few in social sciences.
Moreover, we have no ISO 9000 standard nor is something equivalent taught at the PhD level. Our training often involves lots of stats but little on the research practices needed to make the manufacturing process more reliable.
Goméz Goméz (http://oa.upm.es/11014/ in Spanish) has written an interesting dissertation where he proposes using quality control charts and Ishikawa diagrams to analyze replications, and diagnose procedural errors. What I like about it is that he deliberately frames it as a statistical quality control problem, no different from car manufacturing.
I provide an alternative approach using causal diagrams and procedures (http://papers.ssrn.com/sol3/papers.cfm?abstract_id=2496670). The idea is to include the manufacturing process directly in the inference, so we can check the process alongside the theory being tested. After all, the manufacturing output contains information about both aspects.
I don’t know what English department that does type setting and spell checking you’re talking about, but it sure isn’t one I’m familiar with.
Elin:
Neither do I. But I know people from the humanities, including those majoring in English, who work as scientific writing consultants. They do edits and spell checking, especially for scientists with bad English.
They don’t do type setting but they might. Most Latex article templates are horrible yet good design can really help deliver the message. People sell WordPress templates.
I have never used such services though I really should.
IN some venues, such numbers would be accurate, given ballot=box stuffing. :-)
Having read through the documentation of R Markdown, I don’t understand the title or the rest of the entry. There seems to be logical disconnect between the problem and the solution.
I think he really means SWeave or knitr. That is where you script the creation of the presentation.
Pingback: Sobre o erro do IBGE: dois pontos breves | De Gustibus Non Est Disputandum
Pingback: One Reason to Avoid Excel for Data Analysis » Biostatistics
I don’t think that this CNN mistake is a big deal. It’s embarrassing, true, but after all, anyone with half a brain working will see that it’s just garbage and switch channels. Compare with someone forgetting to wait for the Florida panhandle returns in 2000 (or whatever it was).
Pingback: Catching coding errors, #1 and #2 | Nora Wikoff, MSW, MSLS
Pingback: Your closest collaborator . . . and why you can't talk with her - Statistical Modeling, Causal Inference, and Social Science Statistical Modeling, Causal Inference, and Social Science