Josh Miller shared this email exchange with me, on the topic of you-know-what. This is possibly the most boring thing I’ve ever posted (even counting some of the politics items on the sister blog), but I’m sharing it with you just to get a sense of the kind of things we sometimes see from people who have strong opinions about math.
It all started with someone who objected to Miller and Sanjurjo’s hot hand calculations. Just to spoil any suspense, let me emphasize that Miller and Sanjurjo know what they’re doing. Anyway, Miller led off with a patient explanation, and things continued endlessly from there:
Message #1 from Josh Miller to Mr. Hedge Fund
Here is the problem:
Jack flips a coin 4 times, and then selects one of the heads flips at random and asks Jill: “please predict the next flip.”
Jill asks: what if you selected the final flip, how can I predict the next flip?
Jack responds: I didn’t select the final flip, I selected randomly among the heads flips that were not the final flip.
Jill asks: okay, but its possible there aren’t any heads flips for you to select, right?
Jack responds: I just told you I selected a heads flip!
Jill asks: fine, but what if there weren’t any heads flips for you to select? what would you have done in that case?
Jack responds: I wouldn’t be bothering you with this question.
Jill says: okay then, I predict tails on the next flip.
Jill has made the correct choice.
For most of us, our intuition says that it shouldn’t matter what Jill predicts, there is a 50% chance of a heads on the next flip.
This intuition is wrong. Given the information that she has, Jill knows there is a 40.5% chance of heads on the next flip.
In the long run, if Jill predicts tails every time that Jack asks her to predict, Jill will be right 59.5% of the time.
In the NYT article every possible sequence of four flips is enumerated, but in reality only one of the sequences will be realized, i.e. Jack will ask Jill a question using a single sequence of four flips. There will be no averaging of percentages across sequences, and there is no way for Jill to take a weighted average, and anyway she doesn’t want to—her calculation is correct! For each 4 flip sequence that Jack sets out to produce, there is a 2/16 chance Jack won’t ask Jill any question. But, in the case that Jack does ask Jill a question, the remaining 14 sequences of 4 flips are equally likely. We can calculate the probability that the next flip is a heads by simply taking the arithmetic average of the percentages across the 14 sequences, just as was done in the NYT article. Why is this? The percentage of heads among flips that immediately follow of heads in any of the equally likely sequences is the empirical probability of a heads given that sequence, i.e. when selecting a heads flip at random within the sequence (not the final flip), the percentage is the probability the next flip is a heads. Jill uses the law of total probability, Prob(Head)= Prob(Head | Sequence 1)*Prob(Sequence 1) + Prob(Head | Sequence 2)*Prob(Sequence 2) + … + Prob(Head | Sequence 14)*Prob(Sequence 14)
Now, what does this have to do with the hot hand?
Imagine Steph Curry shows up to the original hot hand study of Gilovich, Vallone, and Tversky (1985). Steph will shoot 100 shots. Suppose Steph Curry always has the same probability of success, for example, like a 50/50 fair coin. Notice we are assuming Steph Curry doesn’t get hot. Now calculate (1) Curry’s field goal percentage on shots taken when his previous 3 shots (or more) are makes and (2) Curry’s field goal percentage on shots taken when his previous 3 shots (or more) are misses. What do expect? If you are like most people, your intuition tells you that you should expect his field goal percentage to be the same in each case. This intuition is incorrect. In fact, you should expect Curry’s field goal percentage to be 46 percent after 3 (or more) makes, and 54 percent after 3 (or more) misses. Steph Curry is expected to shoot 8 percentage points better after 3 misses in a row than after three makes in row. In basketball terms this is a big difference. The existence of this bias has two consequences (1) it invalidates the main conclusion of the original study regarding the non-existence of the hot hand, (2) because the bias is so large, the original conclusion is reversed. On average, the players in the original study shoot 11 percentage points better after 3 or more makes in a row, when correcting for the bias. This is big enough to be significant statistically. As a point estimate, the hot hand effect is large—its magnitude is in the neighborhood of the difference between the median NBA three point shooter, and the very best. Like any estimate there is some uncertainty it its true size, and in our papers we study shooting data in other settings, and the evidence corroborates what is found in the original data of Gilovich, Vallone and Tversky. Something that is re-assuring about our statistical approach: it has a tendency to underestimate how large the hot hand effect can be, for three reasons (1) the selection bias we found is actually worse for hot hand shooters (in comparison to consistent “coin flip” shooters), (2) there is attenuation bias in the estimates, because our proxy for hot hand shooting, streaks of hits, is a weak signal for having a hot hand (known as measurement error), (3) we are averaging across players; to the extent that there is heterogeneity in the effect, hot hand players’ effect size estimates are attenuated by the presence of non hot hand shooters.
Message #2 from Mr. Hedge Fund
Joshua,
I would like to respectfully suggest that you have made a mathematical miscalculation (error) in your “Hot Hand” working paper.
One may not take the arithmetic averages of different sample sizes (you have taken 1/14 of each probability).
I have attached the correct math below.
Using your own words … (see section below) … This is your mistake ….
We can calculate the probability that the next flip is a heads by simply taking the arithmetic average of the percentages across the 14 sequences,
An analogy would be that we both did cancer surveys. Mine had 98 subject, all of which passed away. Yours had 2 subjects, and 1 survived. I believe that our data suggests that 1 in 100 survive, a mortality rate of 99%. Your methodology suggests that the average of the 2 studies is ((100%+50%)/2=) 75% …which is, in fact, THE MATHEMATICAL AVERAGE …but not representative of the data set nor what a doctor would likely tell a patient about their likely mortality.
Here is the problem:
Jack flips a coin 4 times, and then selects one of the heads flips at random and asks Jill: “please predict the next flip.”
Jill says: okay then, I predict tails on the next flip.
Jill has made the correct choice.
For most of us, our intuition says that it shouldn’t matter what Jill predicts, there is a 50% chance of a heads on the next flip.
This intuition is wrong. Given the information that she has, Jill knows there is a 40.5% chance of heads on the next flip.
In the long run, if Jill predicts tails every time that Jack asks her to predict, Jill will be right 59.5% of the time.
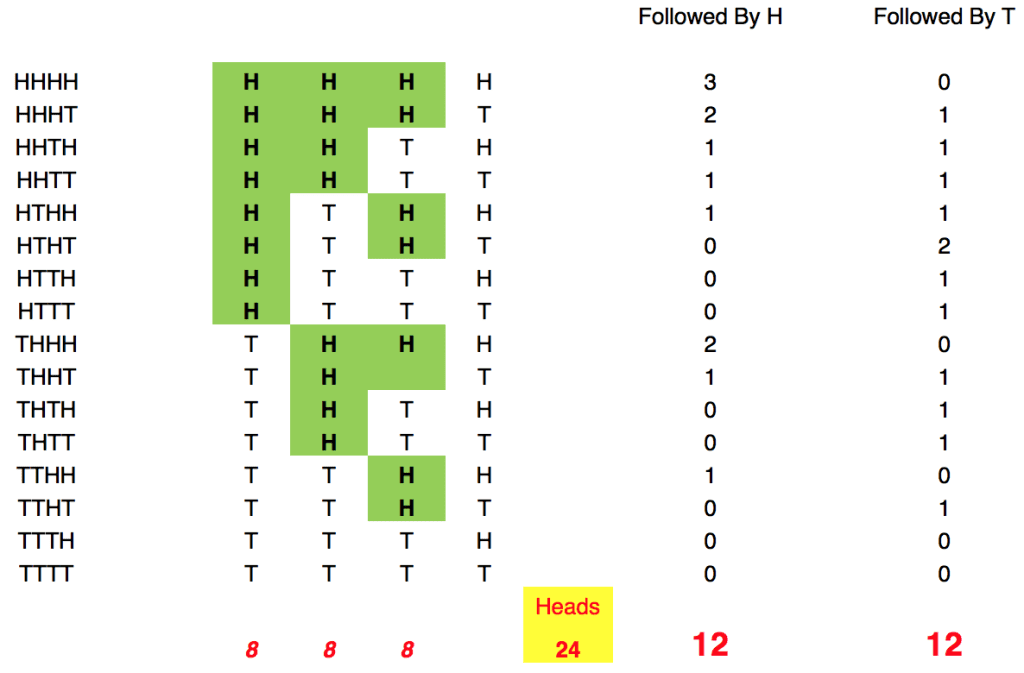
There are 24 (Green) heads, followed by another flip …
Of those 24 heads (randomly selected per Miller [and Sanurjo!] ), there are 24 following flips …12 are heads, 12 are tails … no contorted or tortured math …or conditional probability ….can make 12/24 = 40.5%
THIS IS Your (MILLER’S [and Sanurjo’s!]) ERROR
But, in the case that Jack does ask Jill a question, the remaining 14 sequences of 4 flips are equally likely. We can calculate the probability that the next flip is a heads by simply taking the arithmetic average of the percentages across the 14 sequences, just as was done in the NYT article.
THAT IS NOT CORRECT. WHILE EACH OF THE 14 FLIP SEQUENCES DOES HAVE EQUAL LIKELIHOOD OF OCCURING … THEY HAVE DIFFERING NUMBER OF “HEADS” ….Such that taking the average of the percentages causes a distortion of the true weighted probability. Again, when the math is done correctly, with all 16 flip sequences having 1/16 probability …it is easy to calculate that (what is obvious to the eye) 50% is the correct answer (not 40.5%). Hence my example of cancer patient math …

Message #3 from Miller
Dear Anon
You are not alone:
http://www.rightcallconsulting.com/the-hot-hand-fallacy-is-safe/The yellow highlight is correct. Are you challenging that?
Anyhow, this is a common misconception. If you read the introduction you will understand the importance of the table.
If you would rather cut to the chase, here is a challenge, which if you can answer, will help a great deal:Update—hot hand puzzle. Bet only after a streak of reds, and bet on black, win more than half the time. pic.twitter.com/mRsZL23wLQ
— Joshua B. Miller (@jben0) October 22, 2015
Message #4 from Hedge
Joshua …yes, I am challenging your statement that Jill makes (40.5% is incorrect…the math is flawed, per my prior note).
At the heart of the matter … the flips are independent …with no memory …and you “conditional probability analysis” makes a mathematical error.
I am in complete agreement with rightcallconsulting.
Message #5 from Miller
Dear Anon
Any event with a probability has an associated bet.
Are you willing to bet in that event with payout rates that reflect better than fair odds relative to your beliefs? Say 10,000 times?
I am perfectly okay if you use microsoft excel to generate each of the 10,000 4-flip sequences in the worksheet you sent me.
The true odds that Jack’s next flip is a heads is nearly 1.5 to 1 (40.5% chance), for each sequence before it is flipped (we both commit to not bet for the 2 sequences TTTT and TTTH)
So you bet on heads and I’ll pay you 1.10 to 1, or alternatively I’ll bet on tails and you pay me 0.909 to 1.
Name the stakes, the higher the better!!
Message #6 from Hedge
Happy to make wager, USD denominated, of any size to accommodate…as long as we are in semantic agreement.
Wager is in effect every time a heads comes up on one of the first 3 (if 4) flips …heads on subsequent flip wins for me…tails wins for you and the academics.
Message #7 from Miller
Dear Anon
I think we are converging. . . .
Anyhow, to assure semantic agreement on the proposition.
We will have 10,000 rounds of 4 coin flips.
What is a bet?
1. Coin is flipped 4 times, if there is a head in the sequence that is not the final flip, the bet is on, and we go to 2. If not, we don’t bet this round, and we go to 4.
2. We select at random a heads flip, among the heads flip that are not final flips.
3. If the next flip is a heads, I pay you $11, if the next flip is a tails, you pay me $10.
4. repeat.
Examples of stage 2 & 3:
3 heads flips in the first 3 flips:
e.g. HHHT, there 3 heads flips to choose from {1,2,3} at random (uniform). I don’t know of any 3-sided coins, so we can use random.org, it is objective. Any how, for HHHT, in two cases I pay you $11, in one case you pay me $102 heads flips in the first 3 flips
e.g. THHH, there are 2 heads flips to choose from in positions {2,3}, so we choose between positions 2 & 3 at random (uniform). In each case I pay you $11.1 heads flip in the first 3 flips
e.g. HTTT, no need to randomize. You pay me $10deal?
Message #8 from Hedge
Joshua…I have several backers in addition to myself….and of course a full legal team exploring any loopholes or inadvertent tax consequences of a big score.
Two brief follow up questions:1. how deep are your (collective) pockets …ie, shall we cap the potential loss….or number of “flips” or simulated flips? I suspect my group is a little better funded than yours…but I could be mistaken.
At the risk of stating the obvious, we should each calculate out theoretical (expected value) winnings from a 4×10,000 flip experiment.2. Any reason to do “four flips”…and repeat vs just a string of 40,000 (or more) coin flips?
Message #9 from Miller
Your sense of the odds are correct in this case. Though I’d be willing to leverage. The probability I’d lose is pretty small and there are no black swans here. We can set symmetric barriers. Say $200k.
Yep, 11-10 odds under p=.5, me under p= .6
One long 40,000 sequence is fine, as long as we settle up our bets every four as the rules dictate.
Message #10 from Hedge
Joshua…lets not worry about semantics and random.org and get to the heart of your flawed mathematics (and likely impending bankruptcy):
The wager we propose is as follows:
$10 wagers for each H that comes during a 10,000 4 coin flip sequence:
You pay us 1.1 – 1 for every H following a H ($11) … We pay $10 for every T which follows a H.
Only first 3 flips can generate a wager…all H in the first 3 flips generate a wager:
16 possible sequences: a “heads is expected to come 24 times in the first 3 flips of 16 possible sequences (24/48)…unless you would like to alter that math as well.
The 16 sequences and playoffs are(assuming $10 wagers for each head on the first 3 flips):
1. HHHH … 3 bets…we win $33
2. HHHT … 3 bets…we win $22, you win $10
3. HHTH … 2 bets…we win $11, you win $10
4. HTHH … 2 bets…we win $11, you win $10
5. HHTT … 2 bets…we win $11, you win $10
6. HTTH … 1 bet…you win $10
7. HTHT … 2 bets, you win $20
8. HTTT … 1 bet, you win $10
9. THHH … 2 bets…we win $22
10.THHT … 2 bets…we win $11, you win $10
11.THTH … 1 bet… You win $10
12.THTT … 1 bet… you win $10
13.TTHH … 1 bet… We win $11
14.TTHT …1 bet… You win $10
15.TTTH … No bets
16.TTTT … No betsSettle up after each 4 sequence flip…per the above table.
Any sense of timing?
Over to you….
Message #11 from Miller
I see you have conceded the point. ;-)
Message #12 from Hedge
?
Message #13 from Hedge
Afraid I do not understand
Message #14 from Miller
Dear Anon
Recall your objection was with this statement (which you highlighted in yellow)
“This intuition is wrong. Given the information that she has, Jill knows there is a 40.5% chance of heads on the next flip.”And you were very clear that you objected to it. Further we were both very clear that we were betting to resolve this.
Jack selects a single heads-flip at random, and we are betting on the *next* flip. Jack doesn’t not select all heads flips. This means we bet on one flip every four flips (at most).
If you are unwilling to make this 1.1-1 bet, you automatically concede that Jill is right to believe that that the next flip has a less than 0.5 probability of being a heads.
end of conversation, so far….
Having waded through all that, I think someone may need to make the point explicit that the fundamental issue is whether HHHx results in 3 bets, or 1.
Betting on the continuation of global warming may be more profitable :-)
Amen!
Seconding James Annan’s point above. I think Miller isn’t doing a very good job of explaining his point. In response to the first email from the hedge fund guy, I would have said something like “Yes, I agree! Doing the averaging in this way introduces a bias. That is precisely our point. We are not proposing this as a new averaging scheme — it is the technique that previous work in this area has used, and we are just describing how the bias it introduced masked the hot hand effect in the data.” Then after making that main point clear he could have gotten into the technical issue of weighting by number of attempts vs weighting by number of makes.
+1 Daniel Weissman. But I did find this exchange amusing.
Hi Daniel
Just noticed Andrew’s post (this email exchange was from October).
In case you care, something was missing in the copy-paste to the blog post, which is natural, because, as Andrew said, it was so boring. Here is a link to a screen shot of the original email I was sent, which had more of a ransom note quality: https://dl.dropboxusercontent.com/u/15023778/MrHedge.jpg
Notice the yellow highlight he added which didn’t show up in Andrew’s post. It was clear we were talking about the probability of a heads on a flip within a single sequence. Unfortunately he was anchored on his initial representation that he couldn’t see the probability problem for what it was. I didn’t put any effort working with his representation of the problem, I didn’t have the energy [there were dozens of emails that started like this].
that said, we have definitely gotten better at explaining our point to a more diverse audience, we now have an explainer http://papers.ssrn.com/sol3/papers.cfm?abstract_id=2728151
thanks
here is an updated link to the ransom note, dropbox changed the url
Danilel,
Are you the Daniel Weissman from the Simons program two years back?
Dan
I don’t think this is boring at all! On the contrary, I think this is education at its best — having taking the time to work out a formal specification of a bet, Hedge has now understood that the question whose answer is 50% is not the same one Miller is asking, and I would guess he now understands better the point that Miller is making.
Obviously, I do not know who Hedge is but I do know that Jordan Ellenberg wrote about this in November of 2015:
http://www.slate.com/articles/health_and_science/science/2015/11/solution_to_coin_flip_paradox_when_to_bet_heads_or_tails.html
Instead of Jack and Jill, he has Toby and Marla and only 3 flips rather than the much-discussed 4 flips(and thus, easier to follow the involved and non-intuitive reasoning). Ellenberg discusses in great detail when via Toby’s info Marla will be able to predict Tails better than 50% (about 65% with 3 flips rather than the 60% with 4 flips) and when she won’t. He does this via game theory –Toby actively trying to prevent Marla succeeding.
As an aside, Ellenberg notes “At its heart, Toby and Marla’s story gets at the same issue as some of the other members of the probability paradox hit parade. Like the ‘son born on Tuesday’ paradox: One of Sue’s kids is a son born on Tuesday. What’s the chance her other kid is a boy?”
0.5
+0.5
The correct answer is 13/27. See
http://statmodeling.stat.columbia.edu/2010/05/27/hype_about_cond/
The general formula turns out to be
(2-1/x)/(4-1/x)
where x is the splitting–7 if days of the week, 2 if AM and PM, 12 if month, etc. As x gets larger, the result approached the value of 1.
Isn’t that the answer if only one son is born on a Tuesday.
There is no correct answer unless you make some additional assumptions. How do you know that “one of Sue’s kids is a son born on Tuesday”? If you met by chance one of her kids and it happened to be a boy who was born on a Tuesday you still know exactly nothing about the other.
Paul: Thanks for the trip down memory lane …
Oops!
” As x gets larger, the result approached the value of 1.”
That should be ” As x gets larger, the result approached the value of 1/2.”
Paul-
The boy born on Tuesday link is nice.
So many comments to read but if the implied series of questions is (1) How many kids to you have? “2” (2) Do you have a Boy? “Yes.” (3) What on what 1,…,x epoch was he born? “epoch i” Then it’s easy to show that the probability is 1/3, not 13/27. I am sure that’s discussed.
If the question is: “do you have a boy that is born in epoch i?” and the answer is yes, then agreed, the probability increases (assuming x>1).
Our paper “A Bridge from Monty Hall to the Hot Hand: Restricted Choice, Selection Bias, and Empirical Practice” provides an easy way to intuitively demonstrate this — reason with odds. The intuition is in the paper, so here is the application
Clearly,
Pr(Yes| GG) = 0
Pr(Yes| GB) =1/x
Pr(Yes| BG) =1/x
Pr(Yes | BB)= (2x-1)/x^2
Because BB is (2x-1)/x times more restricted to produce a “yes” answer than GB or BG, then with equal prior odds, the posterior (relative) odds in favor of BB are (2x-1)/x:1 with respect to each of these cases. With (2x-1)/x chances in favor and 2 chances against, the posterior odds in favor of BB relative to any other case is (2x-1)/x:2, and clearly as x-> infinity the odds become even.
Of course odds can be converted to a probability by dividing the chances in favor by the total number of chances: Pr(BB|yes) = (2x-1)/x/((2x-1)/x+2)=(2x-1)/(4x-1)
Sorry, this link should work: “A Bridge from Monty Hall to the Hot Hand: Restricted Choice, Selection Bias, and Empirical Practice”
So I get the main argument from Miller regarding coin flips, and why there’s a 40.5% chance of heads on the next flip. But how does the roulette example work? There are only two sequences of length 4 that begin with 3 reds. One ends in black, the other in red. I assume the problem is analogous to the coin flip one, but I’m not seeing how. Anyone care to give a quick explanation or point me in the right direction?
The roulette example considers runs of Rs in sequences of length 100; if you only look at sequences of length 4 you won’t see the effect. But you can see something similar if you consider sequences of length 5. There are 6 such sequences which contain a run of 3 Rs followed by another play (RRRBR, RRRBB, BRRRB, RRRRB, BRRRR, RRRRR). In any of the first three cases, you win all of your bets; in the fourth case, you win half your bets; in the last two cases, you win all your bets. So if you played this tonight you’d expect to win (1+1+1+0.5+0+0)/6 = 58.3% of your bets, and on nights where you bet you’d break even or better 4/6 = 66.7% of the time. The reason you can’t make money this way is that your expected number of bets is slightly higher on losing nights than on winning nights.
Sorry, that should say you *lose* all your bets in the last two cases.
Ugh. I don’t know how I missed the 100 spins part. Yes, that makes sense. Thank you!
Yes, Hedge does not understand the bet yet. They believe that they bet on every flip that results in heads, while in fact they should be betting on a particular sequence of four, then going on to the next sequence of four.
Not boring at all. Extremely fun. More of this plz.
What made this click for me is realizing that it’s isomorphic to the Monty Hall problem, with the scorekeeper playing the role of Monty. The scorekeeper’s decision to encode a series of events as a “streak” after the fact gives you information about what else happened, just like Monty’s choice of which door to show.
The Monty Hall problem was Week 2 of my first formal decision theory course in graduate school in the early 90s. I was very proud that I instantly saw the crux of the problem and was able to explain it. As it happens, I took Tversky’s psych of decision making class soon after. I’m chagrined to admit that I did not spot the problem with his hot hand analysis back then. I had all the pieces right in front of me. Would have saved everyone a lot of angst over the last 25 years :-)
I’m missing something on the roulette wheel example.
I programmed what I think is going on in R… (except I made if 10 million and 3 spins)
set.seed(10)
x<-sample(c(0,1),replace=TRUE,size=3)
N<-10000000
count<-0
denom<-0
for (i in 1:N) {
y<-sample(c(0,1),replace=TRUE,size=1)
if (sum(x)==3) {
denom<-denom+1 #going to bet
if (y==0) {
count<-count+1 # win on the bet
}
}
x<-c(x[2:3],y)
}
count/denom
#0.500098
And even if you say that the series starts again after observing the 4th spin after 3 reds then it still comes out at 0.5 (more or less)
set.seed(11)
x<-sample(c(0,1),replace=TRUE,size=3)
N<-10000000
count<-0
denom<-0
for (i in 1:N) {
y<-sample(c(0,1),replace=TRUE,size=1)
if (sum(x)==3) {
denom<-denom+1
x<-sample(c(0,1),replace=TRUE,size=3)
if (y==0) {
count<-count+1
}
}
if (sum(x) != 3 ) {
x<-c(x[2:3],y)
}
}
count/denom
# 0.4997373
It comes out at 0.5 either way.
OK, I get it, it’s the limitation on the number of spins that makes the difference.
set.seed(10)
SN<-100000
supercount<-c()
for (j in 1:SN) {
x<-sample(c(0,1),replace=TRUE,size=3)
N<-100
count<-0
denom<-0
for (i in 1:N) {
y<-sample(c(0,1),replace=TRUE,size=1)
if (sum(x)==3) {
denom<-denom+1
if (y==1) {
count<-count+1
}
}
x 0 ) {
supercount<-c(supercount,count/denom)
}
}
mean(supercount)
Steven Landsburg is probably not Andrew’s favorite economist:
http://statmodeling.stat.columbia.edu/2012/03/15/economics-now-freudian-psychology-in-the-1950s-more-on-the-incoherence-of-economics-exceptionalism/
However, Landsburg’s puzzles are worth looking at for several reasons. He too offers to bet a large amount of money ($15,000) that his answer to a probability puzzle (a version of a famous Google interview puzzle of a while back) is correct. When people say his answer is wrong, he replies that they are in fact, solving a different puzzle from the one he proposed. He further chastises those who say they got a right answer when they used the wrong reasoning. Then, when the hot hand of M&S came along, he connects his previous puzzle with it and states
“My experience in the classroom tells me that if you want to convince people that an idea does matter, the most effective strategy is to show them an application to sports. Where were M and S when I needed them five years ago?”
The M&S paper is really more about the gambler’s fallacy than it is about hot hands–invoking basketball knowledge muddies the water. The blue curve in Figure 1 shows that when looking at two flips at a time, HH and HT are equally likely; for 3 flips the calculation yields .417 and .583; for 4 flips the calculation yields .405 and .595. The curve eventually then bends upward ever so slowly towards .5, so that even after many tens of flips a bias is still evident to the naked eye.
It seems to me that the disagreement between M&S and Hedge is that they have different models in mind. Hedge’s model is E[Tail at time t+1| Head at time t] so we are looking at pairs of flips, hence the .5. M&S’s model looks at four flips at a time and non-intuitively, is different.
Echoing Jordan Ellenberg, perhaps one more point should be made about averaging. We all know and love the expectation operator because E[aX + bY] = aE[X] + bE[Y]. However, even though E[X] may equal E[Y], E[X]/(E[X] + E[Y]) is not the same as E[ X/(X+Y)] and may not equal .5; and E[X/Y] is asking for disaster.
Hi Paul
Yeah, Steven Landsburg actually wrote about the hot hand and its connection here to his proposition bets here: http://www.thebigquestions.com/2015/10/07/boys-girls-and-hot-hands/
We discuss where it connects (and doesn’t) in our primer here: http://ssrn.com/abstract=2728151
Also Jordan Ellenberg did make a point about averaging averages in his other Slate article
http://www.slate.com/articles/health_and_science/science/2015/10/hot_hands_in_basketball_are_real_new_analysis_shows.html
and we discuss the averaging averages issue also in the same primer above.
With regards to whether our paper is really more about the gambler’s fallacy, it depends on your interest. The paper show that the original paper which concluded that belief in the hot hand is a cognitive illusion (fallacy), was in fact obscuring the opposite effect, so in a sense, Dan Kahan coined it, it is the hot hand fallacy fallacy.
Minor correction for the Twitter roulette game: ~11% of nights break even, ~49% of nights strictly ahead, ~40% of nights strictly behind, more in our paper on probability puzzles here http://ssrn.com/abstract=2709837
Andrew, this was the least boring email conversation I have seen in a long while :)
I think Miller has a great point: his “Jack and Jill” aggregation method is counterintuitive, but it’s exactly what Gilovich et al. did when they aggregated the percentages by player instead of counting all shots together. This all inspired me to look at Gilovich’s original article to see what evidence hides when you actually look at all equal shots together. I ignored the first experiment (76ers field goals) because field goals aren’t created equal: if the defense focuses on the “hot” player, that would negate his hot hand.
For free throws by the Celtics, naive estimates predicted an 8% gap and the actual gap was… 4.5% (78.9% after a make, 74.3% after a miss). This is confounded by better players making the first free throw more often, so instead I aggregated the two players that shot 75% (Maxwell and Hendo) and the four that shot between 70.5%-7.2%. The “hot hand gaps” were 3.5% and 3.2%, respectively.
What’s funny is that Gilovich makes the opposite of the error you usually lament, when researchers automatically treat a rejection of the null as support of their pet hypothesis. Here, the opposite happens: Gilovich argues for the null (0%) because 3%-4% isn’t enough to reject it at p=0.05. This is hilarious to a Bayesian: a 4% measured gap is as much evidence for the true gap being 8% (predicted by the survey) as it is for 0%.
In his last study, Gilovich took 26 players and made them shoot from a distance at which they all hit 50% – perfect for aggregating their shots together. When you do that, the results are striking: players hit 40.3% after 3 misses and 57.2% after 3 makes! By averaging the players instead of the shots Gilovich manages to Simpson-paradox himself away from a truly momentous piece of hot hand discovery.
I love it when a study provides all the evidence for its own refutation, I’m going to write this up soon at Putanumonit.
Here it is, for those who just can’t get enough hot-hand analysis.
Your one-liners are excellent!I particularly like