Here’s the story. In 2010, sociologists Aliya Saperstein and Andrew Penner published in the journal Social Problems a paper, “The race of a criminal record: How incarceration colors racial perceptions,” reporting:
This study extends the conversation by exploring whether being incarcerated affects how individuals perceive their own race as well as how they are perceived by others, using unique longitudinal data from the 1979 National Longitudinal Survey of Youth. Results show that respondents who have been incarcerated are more likely to identify and be seen as black, and less likely to identify and be seen as white, regardless of how they were perceived or identifed previously. This suggests that race is not a fixed characteristic of individuals but is flexible and continually negotiated in everyday interactions.
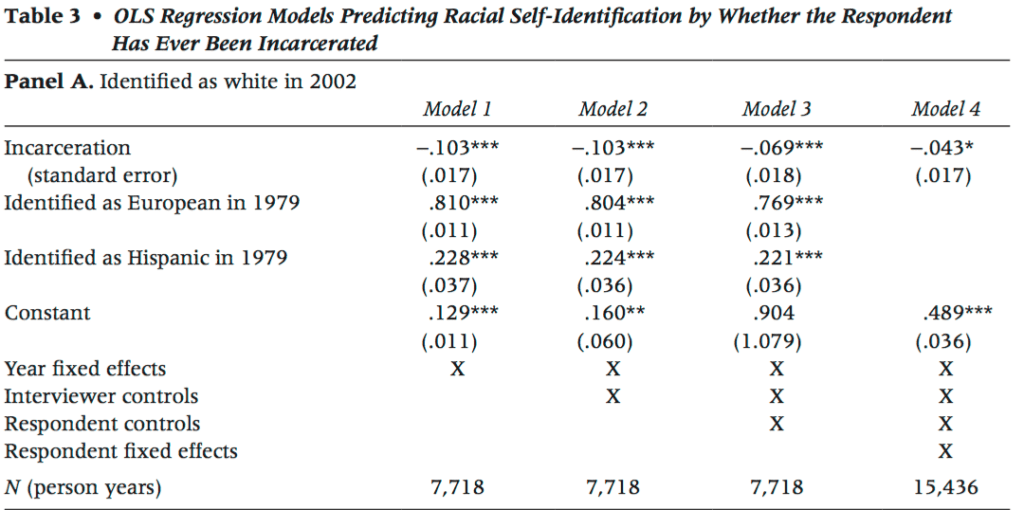
Here’s their key table:
And here’s how they summarize their results:
Our first models estimate the likelihood of identifying as either white (versus all else) or black (versus all else) in 2002, controlling for incarceration history and self-identification in 1979. In both panels, we then introduce our control variables, one set a time, to examine whether or not they account for the main effect of incarceration on racial self-identification. First, we add the interviewer controls as a group, followed by both the interviewer and respondent controls and, finally, respondent fixed effects. Coefficients represent the likelihood of identifying as either white or black, depending on the model. Positive coef cients mean the respondent was more likely to identify as the given race; negative coefficients mean the respondent was less likely to do so.
Table 3 shows that respondents who were incarcerated between 1979 and 2002 are less likely to subsequently identify as white (Panel A, Model 1). This effect holds when interviewer characteristics are included (Panel A, Model 2), and though it is slightly reduced by the inclusion of respondent characteristics, such as income and marital status (Model 3), and respondent fixed effects (Model 4), it remains relatively large and statistically significant (-.043) in the final model.
As the years went on, this work got some publicity (for example, here’s something from NPR) but when I first heard about this finding I was worried about measurement error. In particular, the above regression can only give results because there are people who change their racial classification, and there’s only some subset of people who will do this. (For example, I’ll never be counted as “black” no matter how many times I go to jail.) A key predictor variable in the regression model is self-identificated race at time 1 of the survey. But this variable is itself measured with error (or, we might say, variation). This error could well be correlated with incarceration, and this raises the possibility that the above results are all statistical artifacts of error (or variation) in a predictor.
I made a mental note of this but didn’t do anything about it. Then a few years later I was talking with someone who told me about a recent research project reanalyzing these data more carefully.
The researchers on this new paper, Lance Hannon and Robert DeFina, conclude that the much-publicized Saperstein and Penner findings were erroneous:
We [Hannon and DeFina] replicate and reexamine Saperstein and Penner’s prominent 2010 study which asks whether incarceration changes the probability that an individual will be seen as black or white (regardless of the individual’s phenotype). Our reexamination shows that only a small part of their empirical analysis is suitable for addressing this question (the fixed-effects estimates), and that these results are extremely fragile. Using data from the National Longitudinal Survey of Youth, we find that being interviewed in jail/prison does not increase the survey respondent’s likelihood of being classified as black, and avoiding incarceration during the survey period does not increase a person’s chances of being seen as white. We conclude that the empirical component of Saperstein and Penner’s work needs to be reconsidered and new methods for testing their thesis should be investigated. The data are provided for other researchers to explore.
This new paper appeared in Sociological Science, a new journal that is much more accepting of critical give and take, compared to traditional sociology journals (about which, see here, for example).
At one point, Hannon and DeFina write:
(1) interviewers will arbitrarily switch between white and other when forced to fit certain types of respondents into a Black-White-Other coding scheme (Smith 1997) and (2) people that are unambiguously white are less likely to be subjected to incarceration.
This is similar to my point above—with the big difference, of course, that Hannon and DeFina actually look at the data rather than just speculating.
A defensive response by an author of the original paper?
Sociological Science has a comment section, and Aliya Saperstein, one of the authors of that original paper, replied there. But the reply didn’t impress me, as she pretty much just repeated her findings without addressing the bias problem. Saperstein concluded her reply with the following:
That said, we would be remiss if we did not acknowledge H&D on one point: case 1738 should have been labeled 1728. We regret the error and any confusion it may have caused.
But I think that bit of sarcasm was a tactical error: in their reply Hannon and DeFina write:
Saperstein and Penner admit to one small error. They note that case 1738 is actually 1728. Unfortunately, case 1728 does not match up to their table either. Before noting that we could not find the classification pattern (in our footnote 5), we searched the data for any cases where 7 of 9 pre-incarceration classifications were white. None exist. This case was not simply mislabeled; the date of incarceration is also off by one period. Given the other abnormalities that we uncovered (see, for example, our footnote 11), we encourage Saperstein and Penner to publicly provide the data and code used to produce their tables.
At that point, Saperstein does admit to a coding error and she suggests that the data and code will be available at some point:
We are currently in the process of assembling a full replication package (designed to take people from the publicly available NLSY data all the way through to our AJS tables), and anticipate posting this as part of the website that will accompany my book (the manuscript for which is currently in progress).
At this point I’m tempted to remind everyone that the original paper came out in 2010 so it’s not clear why in 2016 we should still be waiting some indefinite time for the data and code. But then I remember that I’ve published hundreds of papers in the past few decades and in most cases have not even started to make public repositories of data and code. I send people data and code when they ask, but sometimes it’s all such a mess that I recommend that people just re-start the analysis on their own.
So I’m in no position to criticize Saperstein and Penner for data errors. I will suggest, however, that instead of fighting so tenaciously, they instead thank Hannon and DeFina for noticing errors in their work. Especially if Saperstein is writing a book on this material, she’d want to get things right, no? Ted talks and NPR interviews are fine but ultimately we’re trying to learn about the world.
What went wrong?
So, what happened? Here’s my guess. It’s tricky to fit regression models when the predictors are subject to error. Saperstein and Penner did an analysis that seemed reasonable at the time and they got exciting results, the kind of results we love to see in social science: Surprising, at first counterintuitive, but ultimately making sense in fitting into a deeper view of the world. At this point, they had no real desire to look too hard at their analyses. They were motivated to do robustness studies, slice the data in other ways, whatever, but all with the goal of solidifying and confirming their big finding. Then, later, when a couple of sociologists from Villanova University come by with some questions, their inclination is to brush them off. It feels like someone’s trying to take away a hard-earned win based on a technicality. Missing data, misclassifications, an error in case 1738, etc.: who cares? Once a research team has a big success, it’s hard for them to consider the possibility that it may be a castle built on sand. We’ve seen this before.
What went right?
Sociological Science published Hannon and DeFina’s letter, and Saperstein felt it necessary or appropriate to respond. That’s good. The criticism was registered. Even if Saperstein’s response wasn’t all we might have hoped for, at least there’s open discussion. Next step is to read Saperstein and Penner’s forthcoming response in the American Journal of Sociology. I’m not expecting much, but who knows.
But . . .
The original paper had errors, but these were only revealed after Hannon and DeFina did a major research project of their own. This is how science is supposed to work—but if these two researchers hadn’t gone to all this trouble, the original paper would’ve stood. There must have been many people who had reservations similar to mine about the statistical analysis, but these reservations would not have been part of the scholarly literature (or even the online literature, as I don’t think I ever blogged about it).
Eternal vigilance is the price of liberty.
Racial classification is not the only thing that can switch over time. Decades ago when Kinley Larntz was the chair of the University of Minnesota statistics department, he told this story of why a statistician should always look at the original data and not just a summary of results. Especially when dealing with longitudinal data. He was dealing with a large Minnesota entity’s employee data over the years. The data included yearly salary, gender, age, years with the organization, etc. From this data he remarked, “You would be surprised how often sex changes take place in Minnesota. One year someone is male, the next year he is female and the following year he is back to being a male.”
Asking to look at the original data would sure have saved Don Green a lot of embarrassment!
Apparently now that bathroomgate is in full swing, we’re going to have to hire people to stand outside public restrooms and “look at the original data” as well.
It’s amazing how many times people change sex and also die and come back to life in hospitals. Also amazing how often they have the same vital signs day to day down to three decimal places. In this case, it’s due to cut-and-paste errors (and laziness) on the part of clinicians entering data for electronic medical records.
A novice might also be surprised how often stock prices uptick a factor of 10 or 100 and downtick soon therafter. Just slipped decimal places—those bid/ask numbers can’t be trusted as representing actual bid or ask prices that could be executed.
How common are these errors?
I once briefly thought I had picked up a signal in male breast cancer patient records for increased risk from sex change – turned out to be due to folks coding breast cancer patients just by habit/reflex as female.
How common errors are depends on many things but certainty higher if resources are not being deployed to prevent (e.g. as in most academic research that involves data collection/entry).
Darn – I should have published at least a short note on it before checking if it was real ;-)
Given that I am a co-author with Saperstein on another paper on racial fluidity (in this case switching between “black” and “mulatto in the 19th century US south), I have given some serious thought to what exactly is going on here to produce bias, since it is not particularly well spelled out by Hannon and LaFina. Based on simulations, I believe the potential for bias from reporting error exists in the models that control for prior racial identification (models 1-3 above) but not in the fixed effects model (model 4). Admittedly, the fixed effect estimate is smaller here and if you look at some of S&P’s other work, it tends to be less robust across different dependent variables and model specifications, but I think it is too early to start throwing out the results entirely. Its also difficult to know what proportion of switchers are actually data errors (although I have seen a draft of S&P’s AJS response and I think they have some clever ways of thinking about it, but I won’t steal their thunder).
Here is a replicable simulation in R outlining the source of the bias:
http://pages.uoregon.edu/aarong/reportingerror.html
Wouldn’t individuals of racially ambiguous appearance who go to prison have an incentive to identify racially with the strongest prison gang they can plausibly claim membership in? Generally, while in prison, membership in a black or Latino gang is more favorable for surviving one’s stretch than membership in a white gang, assuming there is one. In return, race-based prison gangs usually call for some kind of enduring marking, such as race-based tattoos, making it harder to switch racial identities back upon leaving prison.
Is there an economic issue here? In other words, is participation in certain programs or getting certain jobs likely to be easier if you identify a certain way, so there is an economic incentive for the identification? In this case, it wouldn’t be incarceration per se, but an effect of post-incarceration incentives.
(i.e. an Elizabeth Warren effect, if not for Senator Warren herself then for the universities that reported her as a minority to show their diversity)
Some people seem to think it is a thing on the labor market. I have not reviewed this carefully, but your comment reminded me that it existed, so figured I’d link it here. In this particular case, my weak prior is more in the Paul Alper realm, but that is not an expert opinion.
http://spot.colorado.edu/~antmanf/AntmanDuncan_RacialIdentificationAABansSHORT.pdf
“We link data on racial self-identification with changes in state-level affirmative action policies to ask whether racial self-identification responds to economic incentives. We find that after a state bans affirmative action, multiracial individuals who face an incentive to identify under affirmative action are about 30 percent less likely to identify with their minority groups. In contrast, multiracial individuals who face a disincentive to identify under affirmative action are roughly 20 percent more likely to identify with their minority groups once affirmative action policies are banned.”
So many of my non white students refuse to answer race questions because they feel they will be discriminated against if they do so. I wish I could say that self-identification would be helpful to them, but it’s not clear in any way that it would at the individual level, it just might help identify patterns of discrimination and helps HR departments document their practices.
Today, the top Brazilian soccer superstar Neymar Jr. sports a racially ambiguous skate punk look that emphasizes his white ancestry. But just a few years ago, before he became rich, he was an ordinary-looking black kid. Here are photos:
http://www.unz.com/isteve/michael-jackson-sammy-sosa-and-neymar/
You don’t see much of that among males in the United States, however. Michael Jackson’s racial phenotype-changing antics were famously unusual.
It’s more common for male celebrities to try to look blacker because it’s seen as looking tougher and more authentic.
I assume the switches are generally black/Latino and white/Latino with only a few black/white. How do we know the stability of the racial identifications or how they vary by context? What if a person can be Latino this year and black the next and you catch them in one way? Or if you identify as Latino in one context and black in another? Why are the reports more than snapshots of particular moments?
No, because Latino/Hispanic is outside of this though as the tables in the paper show “Hispanicity” is important.
@Elin
Yes, I too kept the racial identification section blank. For one I had a low opinion of HR departments in general and any sort race-based policy as well. Maybe I just didn’t feel enough discriminated against.
I just felt it axiomatically obnoxious to put a race related question on those surveys. Sometimes out of spite I would choose “Pacific Islander” or some such random, esoteric category.
I always say I am Asian, which is technically true. Plus I speak Japanese.
Eternal vigilance is the price of liberty.
The tree of liberty must be refreshed from time to time with the ink of sociologists (economists, political scientists, even statisticians). I refrain from the original Jefferson quote because I don’t want Homeland Security impounding Andrew’s server.
Numeric:
I googled the quote and it doesn’t seem to actually be Jefferson’s.
Extract from Thomas Jefferson to William Stephens Smith
Paris Nov. 13. 1787.
the tree of liberty must be refreshed from time to time with the blood of patriots & tyrants. it is it’s natural manure.
http://tjrs.monticello.org/letter/100
Bu hey, maybe Jefferson plagiarized it (another entry in your blog). What google link are you referring to (this may be one of those defeat is an orphan, victory has a 1,000 father type thing, which I actually tracked down at one point and it wasn’t JFK, nor Napoleon, but some obscure Frenchman–if I got it right–no guarantees).
Numeric:
Tree of liberty is Jefferson, sure, no problem. I was referring to eternal vigilance.
Looking up the eternal quote, I do see it’s often attributed to Jefferson, incorrectly. But I never meant the eternal vigilance quote was Jefferson’s–I was merely providing an alternate quote which I thought was apropos (modifying it somewhat). In general, your followups on other’s statistical analyses does draw ink (or pixels, or blook), as referenced by the usual reaction from those who you’ve analyzed. Keep doing it–Jefferson would approve (and this doesn’t mean you approve of Jefferson’s keeping slaves or slave concubines, but that’s a subject for another post).
> But this variable is itself measured with error (or, we might say, variation). This error could well be correlated with incarceration, and this raises the possibility that the above results are all statistical artifacts of error (or variation) in a predictor.
> It’s tricky to fit regression models when the predictors are subject to error.
Isn’t this and resulting influence on error rates the subject of this new paper?
Westfall, J. and Yarkoni, T. (2016). Statistically controlling for confounding constructs is harder than you think. PLoS ONE, 11(3):1–22.
My feeling for this is that it’s related to the way that the GLM only handles error/variance in the Y term (i.e. Y ~ N(,musigma) and mu = b0 + sum(bi*xi) ) and so variance in X violates assumptions. Would SEM (as recommended by Westfall and Yarkoni), errors-in-variables models, etc. help here? Or is there any other model that would work particularly well here? The errors-in-variables seems largely ignored in statistical training for social and psychological science.
(This is more out of curiosity about better modelling choices than about the other scientific/social issues with this particular case.)
To me it is rather strange that they are using OLS for a dichotomous dependent variable. Also, as the acknowledge in the paper, the questions themselves changed over the waves of the study (and this covers the time period where the census changed to allow people to check multiple boxes which was associated with a lot of discussion of multi racial identities as distinct from the prior one drop rule).
And yes people always leave out that issue of variance in X. And here the whole point is … there is variance in X.
I really like the idea of this paper, and it is a really interesting way of thinking about whether every change we see is due to “pure” random measurement error, due to changes in interviewers, due to changes in the measures used, or due to actual changes in identity, with the association with incarceration. I mean yes absolutely it makes sense that incarceration, which is so highly racialized and segregated, might lead to a change in racial identity, whether just because of course it’s almost always safer to be part of the larger group or you might get involved with Nation of Islam or another group. I’d think it would be interesting to look e.g. at the Oklahoma data where there are hardly any incarcerate blacks but lots of incarcerated native Americans.
But honestly .. here is the “person year data” from their paper
Percent currently incarcerated 1.3
Percent previously incarcerated 1.8
Percent ever incarcerated (2002 only) 5.8
Now still with 12000+ unique individuals 5.8% is still 600+ people ever incarcerated and only rounding everything up 240 currently incarcerated … still once you break it down into racial subgroups it gets even smaller. It would be really nice to see racial descriptives on them.
” Indeed, 4.3 percent fewer respondents identified as white and .6 percent more respondents
identified as black as a result of having been in prison. ” … “To put this
claim in perspective, consider that currently nearly 6 million people in the United States have
ever been incarcerated (Bonczar 2003). Based on our results, we would expect that more than
250,000 previously incarcerated individuals no longer identify as white as a result of their
incarceration. ”
Presumably that would also be 36,000 who now identify as black? I mean besides not being clear on how exactly this calculation makes sense doesn’t this cry out for some kind of uncertainty?
I’m also not sure at all what the p values in table 2 are representing, are they just doing a lot of difference in proportions? Better to just present the suggestive data without the p values in my opinion than to do that, the stars actually distract from the interesting results. But again .. telling us the sample sizes for each group would be helpful in knowing how to interpret.
in my research class I start off talking about measurement and why how we ask questions matters with this survey of the students.
https://docs.google.com/forms/d/1SDH0L7DhVL5MPQRsd7vMQar3WMVxtTXoulriOntZl9U/viewanalytics which gets us into some good discussions.
I do really think this is a fantastic and fascinating topic and a cool way to pull information buried in longitudinal data, not to mention to think critically about what normally just gets attributed to measurement error, I just think one needs to be cautious about what it means and take it as more suggestive than anything.