The big story in yesterday’s election is that Donald Trump did about 2% better than predicted from the polls. Trump got 50% of the two-party vote (actually, according to the most recent count, Hillary Clinton won the popular vote, just barely) but was predicted to get only 48%.
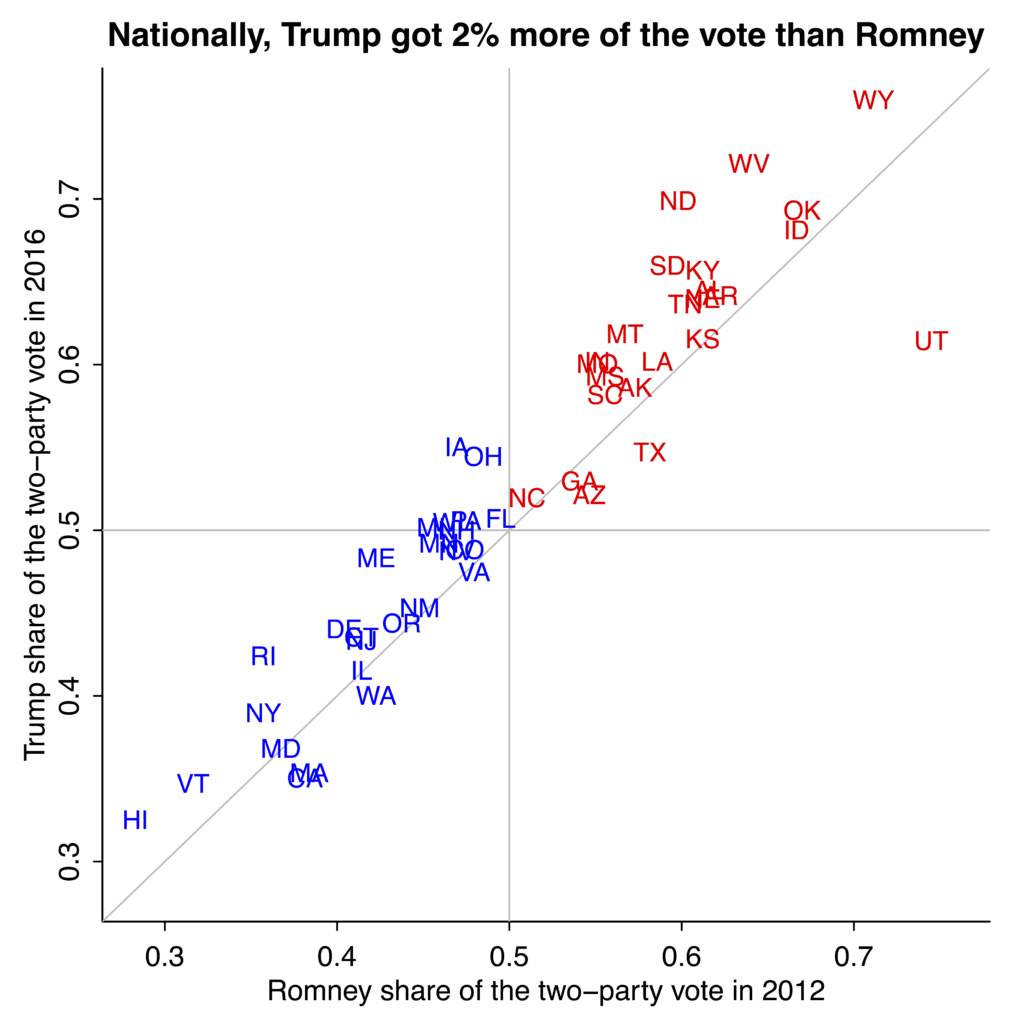
First let’s compare the 2016 election to 2012, state by state:

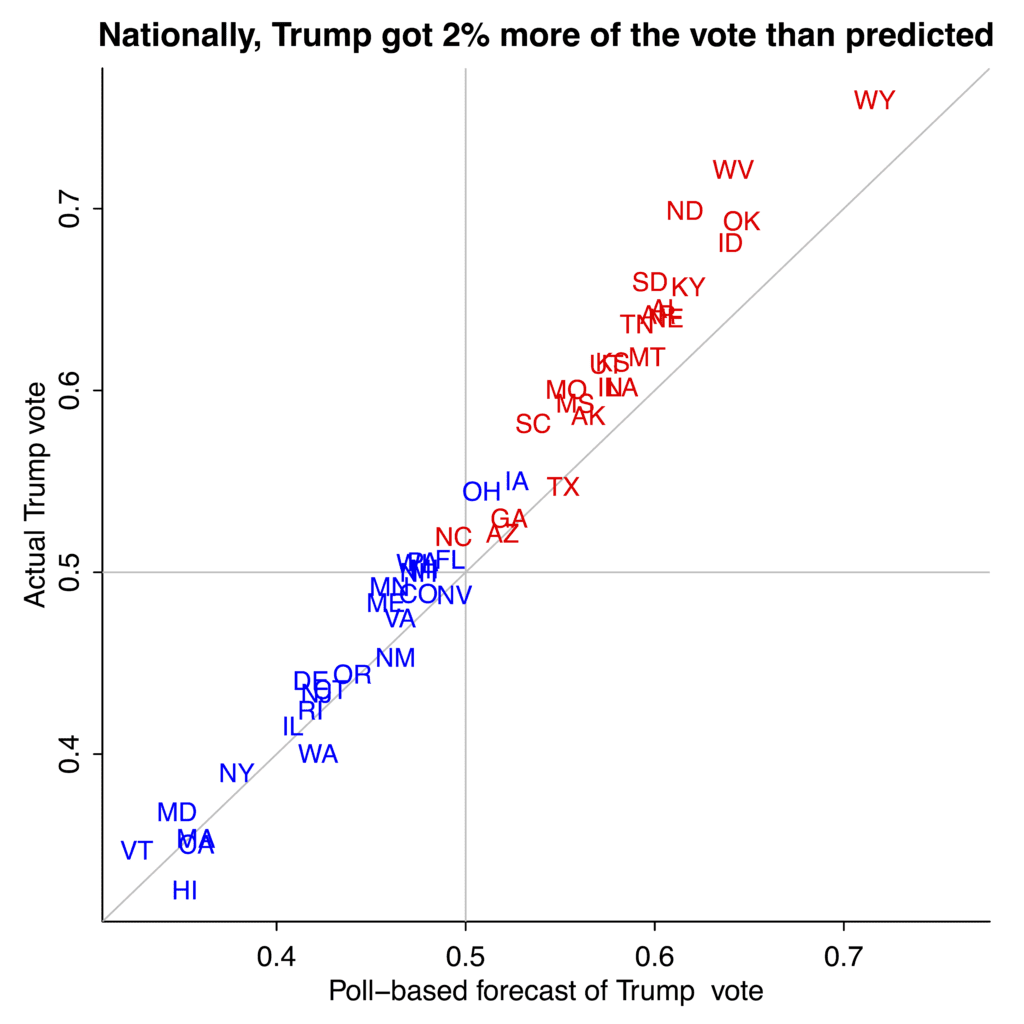
Now let’s look at how the 2016 election turned out, compared to the polls:
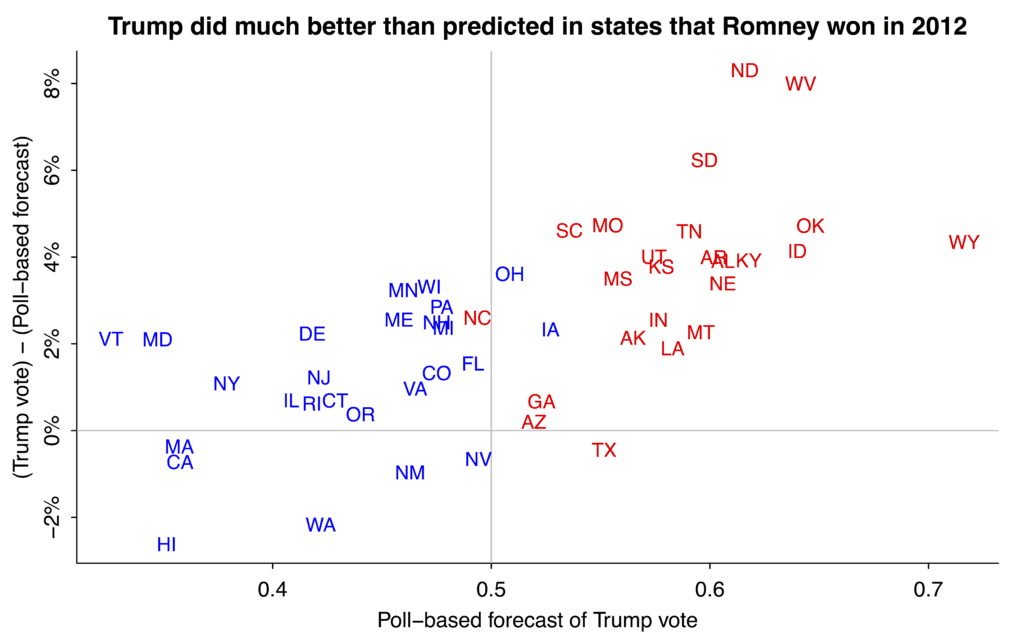
This is interesting. In the blue states (those won by Obama in 2012), Trump did about as well as predicted from the polls (on average, but not in the key swing states of Pennsylvania and Florida). But in the red states, Trump did much better than predicted.
P.S. More here.
This seems to align with the claims that people weren’t willing to admit they supported Trump.
Strong evidence for the Shy Tory factor / Bradley effect being real, and significant.
Seems to me, the lesson is that in future polls we ought to be focusing more on indirect questions than direct ones.
e.g. A Psychiatrist doesn’t diagnose schizophrenia by asking “Are you a schizophrenic?”, right?
No, but I’d say that would be the best single question to identify people who already had a diagnosis. Surely you can’t gain by using a proxy question and omitting the direct one. Bias is likely to be a problem for both.
If social pressure were silencing voter intentions you’d expect results to outperform polling in blue states where that pressure is amplified, not red ones.
Maybe people just hate pollsters and pesky surveyors that they give random answers?
Especially in the red state if ppl are thinking “polls are rigged” and “media are devil”, i will assume they also not willing to response to pollster and interview.
Another possibility in an election such as this one or the Brexit election, is that many voters experience a conflict between how their super-ego tells them to vote and how their id wants to vote. When polled, they may answer according to their super-ego, but when they get into the voting booth, their id takes over.
You had to turn it into “Trump supporters are uneducated emotional «muh America» idiots”.
I put forward what I thought was a reasonable hypothesis, and your judgmental interpretation never occurred to me. I didn’t intend the comment to be political. As for “uneducated”, although a greater percentage of those with only a high school education are reported to have supported Trump than the percentage of those with a college education, a sizable fraction of the latter group did too, and I would think that my hypothesis, if there is any truth to it, would apply more to them than to the high school-educated group.
Yeah, right, Chuck. Your “hypothesis” is a judgement. Maybe the #1 Cognitive Disorder I hear from the losers in this election is, after they make a clearly biased / political / judgemental comment, they say or write: “I didn’t intend the comment to be political.” Welcome to the CBT crowd, Chuck.
Furthermore, my hypothesis applies to any election where there is an emotional choice vs a choice that is viewed by many as logical but uninspiring.
Or evidence that voters not supporting Trump had a harder time voting.
Certainly there’s many instances of legal charges or voter drive crackdowns recorded to back that theory. I don’t know of any actual shy Trump voter evidence. Just because results move in the same direction as one theory doesn’t mean much.
“Or evidence that voters not supporting Trump had a harder time voting.”
How many of you overtly call one of your variables “tinfoilhat”?
Is it preferred over the “iknowclintonwillwinanywayso…” variable?
It’s a subtly different problem than “Shy Trump”. I think Trump’s base in rural America is highly distrustful of institutions, including polling operations, and so were less likely to respond to polls at all.
This strikes me as consonant with Scott’s comment here http://statmodeling.stat.columbia.edu/2016/11/08/election-forecasting-updating-error-ignored-correlations-data-thus-producing-illusory-precision-inferences/#comment-342713
@Rahul: “…focusing more on indirect questions than direct ones.”
“Self-Reporting” is well known as a significant error source in survey-research, but it is so very convenient to ignore it.
Non-Representative population samples are also very convenient (convenience samples) and well known as big error source.
Most political pollsters apparently like convenience in their work.
Indirect-Questions also rely upon self-reporting; doubtful that pollsters would be any more skillful and diligent with such “subtle” questioning methods. Most people don’t trust pollsters these days and don’t want to cooperate with them — that is the basic problem, without a solution.
I think we must try for better solutions at the data collection level. Some ideas: Recruit better quality pollsters. Right now polls are all about quantity and very little quality.
The general perception I get is that the typical survey monkey is like the lowest cost person the polls can hire. Naturally he’s less motivated to elicit a good answer than to just fill in his quota.
The second option I see is to somehow make it more worth the respondents time. Incentive? Maybe. Even more likely, non monetary incentives, perhaps. If I get the feeling that the the poll is actually putting in more effort I might be more likely to give a more truthful answer than if I feel like them exploiting me as a free opportunity.
6 blue states under the line and all the rest above the line, and you interpret this as “about as well as predicted”? And the title “the polls did just fine in the blue states”… seriously? You do realize that it’s because the polls were off in some “blue states” that the results came as something of a surprise… the red states had nothing to do with this!
Mark:
As I wrote in my post above, “on average, but not in the key swing states of Pennsylvania and Florida.”
Andrew, I’m sorry, but that response is lacking in critical thought. Your title is wrong, wrong, wrong.
Mark:
My post was clear on this point but you’re right that my title was not. I will fix the title.
One factor that’s changed between today and 2012, and even more against 2008 2004 …, is that the public is well-informed about the polling results. 8 years ago you might get the relatively bad poll information from TV in the morning before the vote — it maybe wasn’t considered a big deal. Nowadays, everyone has at least 1 app on their phone that tells them right up to the final minute which way it’s heading, and there was widespread trust in polls.
I think voters reacted to polls, said to themselves “well, as long as Trump won’t actually win, I’ll vote for him in protest”. Same story as Brexit.
It is in many places the law that early polling results may not be revealed while polling is still open, to prevent voters from making reflexive considerations. A hundred years ago, when there was very little, very illiquid information, that law would have been super effective. Nowadays, that law is totally meaningless, as the quality of real-time polling is so good as to make early polling results obsolete. Hence voters, thinking they know the outcome, react to the outcome, and change it.
The imbalance between the red and blue state results may reflect a bias among previous non-voters. Much of the rhetoric of the Trump campaign addressed conservatives in red states that had become disillusioned with the Republican party. These voters didn’t vote in previous elections because they didn’t see a difference between the two parties. Trump appealed to these voters, so we get higher turn out in red states. The polls, dependent as they are on past data, couldn’t predict the response differential. This explanation should predict that turn-out in general was higher this year in red states than it was in past years. It also means that polling per se wasn’t the problem, but that any system that tried to use past performance to guide current predictions would be wrong, because the underlying system changed.
“These voters didn’t vote in previous elections because they didn’t see a difference between the two parties.”
This may not be the case. Trump actually got fewer votes than Romney and McCain.
This seems to be cognitive dissonance within Carlos:
“Trump actually got fewer votes than Romney and McCain.”
Not true according to a half-dozen different websites I checked. But then, I didn’t check the Clinton News Network & it would be no surprise if that is your only source for info.
(the #s I see are Romney slightly > 59 M & Trump slightly > 60M) Is that “fewer” in Clinton-Math?
George:
You seem to be pretty angry. Anger is ok but this is a social science and statistics blog so it is good to respect the numbers. I just looked it up on Wikipedia:
Mitt Romney 2012 60,933,504 votes
Donald Trump 2016 60,265,858 votes (so far).
Yes, when someone points out your mistakes & your biases, it is because they are “angry”. Typical dodge of the weak-minded.
I saw the same # on multiple websites & that # is 59.1 M. Here is one of the sites:
http://www.infoplease.com/us/government/2012-presidential-election-vote-summary.html
As for wikipedia, that ranks only slightly ahead of the Clinton News Network & facebook for veracity.
As for “respect the numbers”, the vast majority of you do no such thing. You are using #s from corrupt organizations that have admitted their corruption. You might try respecting the PROCESS of science & statistics.
Lesson #1 = corrupted data is garbage
Lesson #2 = read lesson #1 again
George:
This is kind of exhausting, but, anyway, . . . I looked up the numbers from the Federal Election Commission (http://www.fec.gov/pubrec/fe2012/2012pres.pdf). Go to Popular Vote Summary and you’ll se it:
Barack Obama 65,915,795 votes
Mitt Romney 60,933,504 votes
Wikipedia is actually not so bad. Not perfect, but not so bad and yes I trust Wikipedia and the Federal Election Commission in this case. My guess is that infoplease.com got their numbers from some early report of partial election totals.
Again, emotion is fine: politics is important and if you want to feel angry about the “Clinton News Network” and the “weak-minded” or whatever, go for it. But if the numbers don’t matter to you, then reading this blog might not be the best use of your time.
Yes, I am not surprised that you find #s exhausting. That is why you default to torturing them to try to get the result you wanted in the first place. That is why you default to using easily-available #s from corrupt organizations that have admitted their corruption rather than making a real effort to get clean, objective #s. Understood. Remember, quality costs. Low quality things, such as data, are cheap & readily-available, so have at it with your garbage data.
And keep playing your “angry” dodge whenever someone points out your mistakes & your biases. I’ll bet you’re a prof. You live on campus. The HR department gave you rules. One of the rules is “Avoid any substantive discussion. When confronted with alternative views, say “You seem to be pretty angry. Anger is ok, blah blah blah.” College prof? HR? Rules? Yup.
So, once again, the #s mean far more to me than they do to you or to most people on this blog. Far more. The majority of you are stuck in your narrative, and trying to torture the #s to confirm it. The biases here are deep. A couple of other people here bothered to point them out. They get ignored.
Caring about #s? I made a fortune in my career by being better with #s than 99.9% of the people around me, and the people around me included many people who were there mainly because they were quants. Get the picture? Remember, there are a lot of people in the world who are better at #s & care more about #s than you do. So now, go back to torturing.
Btw, to point out another one of your blind-spots & your lazy thinking on #s:
“numbers from some early report of partial election totals.”
Yes, I thought of that. That is why I used words like “seems” & didn’t give exact #s. I respect #s enough to not fully trust those on most web-sites. Your blind-spot? I already thought about “partial election totals”, but unlike you & the other guy who brought this up, I realize that Trump’s 5 day old #s are far more likely to be partial than are 4 yr old #s. THAT is a big part of the reason I responded to it. The demographic around here seems perfectly willing to draw conclusions from #s that will undoubtedly be revised, without bothering to acknowledge that.
George:
If you trust infoplease.com over the Federal Election Commission, and if you think one of the rules at my workplace is “Avoid any substantive discussion,” then I’m pretty sure you’re wasting your time here. In all seriousness, I think I have nothing to offer that you will find useful.
Another sign of a weak mind: preferring snarky rejoinders over sticking to the point. The point is that it is neither consistent nor accurate to compare partial data received 5 days after one election to complete data 4 years after a different election. Geez, I understood that < 10 seconds after thinking about Trump’s #s vs Romney’s #s. That is exactly why I didn’t use complete data from the Federal Election Commission. It is simply the wrong thing to do in this case.
So, no, I don’t prefer infoplease.com, but I could tell that their data is more comparable to the 5 day old Trump data. You? I don’t know about the rest of your work, but in this project, you’re showing pitiful data analysis skills.
substantive discussion? If you want one & you’re on a US college campus today, get to your safe space with coloring books, puppies, Play-doh & a variety of other therapies.
University of Michigan Law School scheduled “post-election self-care” event with “food and play, coloring sheets, play dough, positive card-making, Legos and bubbles with your fellow law students.”
Stanford offered psychological counseling so students and faculty could manage their “uncertainty, anger, anxiety and/or fear” following the election.
U Penn opened a post-election safe space with puppies and coloring books. If you bought stock in the company that makes coloring books, expect a gangbuster Q4.
Cornell needed a “Cry-in”, where students wrote their reactions and emotions on poster boards with colored markers, or with chalk on the ground. Thank god a barista brought them warm drinks to maintain energy & hydration.
Yale had a “group scream.”
Tufts offered arts and crafts.
U Kansas offered “therapy dogs”.
I’ll correct you one more time but this one is in your favor. You DID offer me something useful. The charts on this page are excellent. They’re how I ended up here. I thought about comparing Trump’s #s with both expectations & with Romney & McCain. I decided it wasn’t worth the hour it would probably take to do it from raw data. I built a Boolean search to get what I wanted & “Bingo”, your blog was in the top few results. So, thanks much for the charts. They are very well done. There one labeled “Trump did much better …” tells muc to those who know how to listen to #s.
And now, 2 weeks later, your pitiful “data analysis” is shown to be wrong, as I told you it would be. Latest update: “nearly three weeks after the November 8 election, Clinton as of Sunday afternoon had won 64,654,445 votes nationwide, according to the latest totals compiled by the nonpartisan Cook Political Report. Trump had a total of 62,418,792.” So, now it stands at Romney 60.9 & Trump @ 62.4.
Care to retract your “analysis”. Ha. You’d need some integrity to do that. Nobody will hold their breath for you to gain integrity. You’re a partisan with pitiful data analysis skills.
And now I return you to your Clinton Math. glwt
Andrew has written critically several times about Allan Lichtman’s method of predicting the outcome of a presidential election via 13 “Keys” or historical factors:
http://www.fox5dc.com/news/politics/208017341-story
Here is Lichtman’s prediction for 2016:
“With only 6 ‘true’ judgments of the 13 keys, Lichtman says his system predicts Donald Trump will defeat Hillary Clinton in the election this fall.”
Lichtman is not clear, however, whether he means the popular vote or the electoral vote. He hedges his bets:
Despite these results, Lichtman told us he is putting an “asterisk” on his prediction.
“The first time ever I am putting a qualification on my pick,” he said. “I’m not a psychic. I don’t look in a crystal ball. I look at patterns and history, and patterns can be broken. They never have been broken before, but we have never seen anyone like Donald Trump.”
Apropos of nothing, Lichtman has the most Trumpesque hair I’ve ever seen on someone not named Donald Trump.