Amos Elberg writes:
I’m writing to let you know about a drug trial you may find interesting from a statistical perspective.
As you may know, the relatively recent “orphan drug” laws allow (basically) companies that can prove an off-patent drug treats an otherwise untreatable illness, to obtain intellectual property protection for otherwise generic or dead drugs. This has led to a new business of trying large numbers of combinations of otherwise-unused drugs against a large number of untreatable illnesses, with a large number of success criteria.
Charcot-Marie-Tooth (CMT) is a moderately rare genetic degenerative peripheral nerve disease with no known treatment. CMT causes the Schwann cells, which surround the peripheral nerves, to weaken and eventually die, leading to demyelination of the nerves, a loss of nerve conduction velocity, and an eventual loss of nerve efficacy.
PXT3003 is a drug currently in Phase 2 clinical testing to treat CMT. PXT3003 consists of a mixture of low doses of baclofen (an off-patent muscle relaxant), naltrexone (an off-patent medication used to treat alcoholism and opiate dependency), and sorbitol (a sugar substitute.)
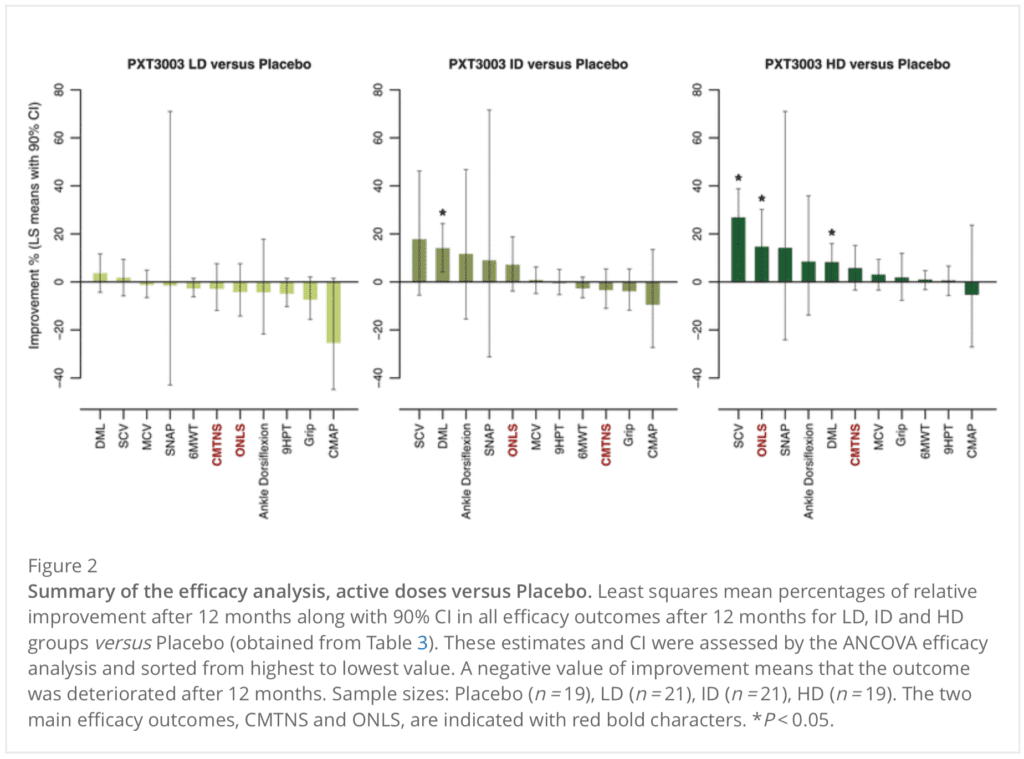
Pre-phase 2 results from PXT3003 are shown here.
I call your attention to Figure 2 [above], and note that in Phase 2, efficacy will be measured exclusively by the ONLS score.
My reply: 33 comparisons, 4 are statistically significant: much more than the 1.65 that would be expected by chance alone, so what’s the problem??
In all seriousness, I’d recommend they fit a multilevel model. That said, I’ve never fit such a model for this sort of experiment. I’d like to do it (at least) once, for a live example, as I think this would help me better understand the statistical issues and then I’d be able to make more helpful recommendations.
It’s striking that the tests/traits that have the smallest CIs show no apparent changes at any dose. So either there are really no effective changes, or the medications only improve certain tests/traits (if indeed any are actually improved) and not others. Someone who understands the condition could think about whether the second would be plausible.
I suppose that “ONLS” means “Overall Neuropathy Limitations Scale”. If you consider the improvement in ONLS vs dose (which seems to be the obvious choice for multilevel modeling), there is a small increase with dose, but the CIs are too large to tell for sure. If you just took the difference between high dose and no dose, and propagated the CIs, it looks (absent having the actual numbers to compute with) as if the difference would not have a significant p-value. This could be one of those cases where the mean, being the best unbiased estimate, could indicate something even if it’s not “statistically significant”. But there’s probably too much noise to really tell.
To me, these results call out for another test at an even higher dose. But I suppose that won’t be in the cards.
It’s interesting because my thought process is totally different than what is found in your 2nd paragraph but I would come to the same conclusion: They need to collect enough dose-response data to cover the entire curve. In my case it is so that we can come up with models of what is going on consistent with this curve (There are some other issues w the data etc but I’m ignoring that for now).
Can you give more detail on how you link the ideas in your second paragraph to your conclusion? Specifically, I see these as your premises (there are probably unstated ones that need to be filled in):
p1) there is a small increase with dose, but the CIs are too large to tell for sure
p2) the difference between high dose and no dose…would not have a significant p-value
p3) the mean could indicate something even if it’s not “statistically significant”
And here is your conclusion:
C) these results call out for another test at an even higher dose
Basically, I don’t see how the conclusion follows from what you wrote. For comparison, here is my reasoning in the same format:
p1) The dose response curve contains useful info about what is going on when people are given this drug
p2) Having data on the entire curve (including upper plateau) will constrain the number of explanations for what is happening when people take this drug
p3) It would be useful to have explanations/models that predict the dose response curve
p4) It isn’t clear whether the highest dose tested was at the upper plateau or not
Therefore:
C) these results call out for another test at an even higher dose
Is it possible for anyone else to follow my reasoning here?
Your reasoning makes sense to me (but I haven’t read what’s in the link provided).
Thanks, it isn’t really about this in particular so I don’t think reading the paper is necessary to follow the logic. I really only glanced at it.
Anoneuoid:
I think your reasoning is very odd in that it treats all measures of dose effect as exact. A very peculiar view from someone who believes all researchers are just chasing noise.
While I understand your point (errors are of second order interest), I think Tom’s reasoning is totally fine in that he is saying that random error is so high it’s hard to pick out signal from noise. By upping the dosage, we presumably strengthen the signal (unless we’ve hit a plateau).
How so? If it reads like that there is a communication issue, because nothing could be farther from the truth regarding the thought process I attempted to describe.
Not sure why there is a strawman introduced here, but lets ignore for now…
I’m not sure what you mean. Perhaps by “errors” you mean false positive/negative? In that case, they are totally irrelevant to the reason I would want more data. If the ONLS score means anything, I assume there is a non-zero effect of taking this pill.
Thanks, so something like:
p1) there is a small increase with dose, but the CIs are too large to tell for sure
p2) the difference between high dose and no dose…would not have a significant p-value
p3) the mean could indicate something even if it’s not “statistically significant”
p4) upping the dosage may increase the change in ONLS score
p5) it would be useful to know whether this treatment has any effect at all on ONLS score
Conclusion:
C) these results call out for another test at an even higher dose
Does that fit? I could follow this line of reasoning, but it was non-obvious to me (no sarcasm). Of course, I reject “premise 5”, since I would assume some non-zero effect exists by default.
For those experiencing deja vu: this was posted already (with different comments from Andrew, and without mentioning the original poster) on October 16.
Carlos:
That’s funny. So many posts, it’s hard for me to keep track!
I have deja vu events that are pre-migraine. I read this post and my immediate thought was, oh crap – I’m going to getting a migraine. But this time the deja vu is real. So maybe no migraine.
33 comparisons! I think the significance level should be adjusted, simply said, it should be decreased from 0.05 to 0.05/33 to avoid the p-hacking issue
Are these 3 studies with a treatment/placebo arm or 1 study with 3 treatment levels and placebo? Typically Dunnett’s intervals and tests are used for multiple comparisons to one control group. It would be wrong to reset alpha to .05/33 (too conservative) but there are various ranking procedures used in pharma statistics to adjust p-values from multiple endpoints. Another approach is p-value combinations that obtain an overall test statistic. These methods are used in the genomics world and I find are useful when clinicians are obsessed with significance for a handful of tests.
If there are 3 separate studies with different control populations the variability of the endpoints can be assessed and brought into the comparison. As far a multi-level modeling, this is all at one level of grouping and I am not sure how much low information priors could contribute. But a phase 2 study with more dosing levels can definitely use this data for setting some type of prior assumptions.
Agree – this seems like a standard multiple endpoint problem and 0.05/33 is too conservative. If one wants classical hypothesis testing, I think the place to start is
https://scholar.google.com/scholar?hl=en&as_sdt=0%2C5&q=Procedures+for+comparing+samples+with+multiple+endpoints&btnG=
And this is a more modern treatment, developed for genomic data with many thousands of endpoints but equally useful for only a few.
https://scholar.google.com/scholar?hl=en&as_sdt=0%2C5&q=ROAST%3A+rotation+gene+set+tests+for+complex+microarray+experiments+&btnG=
Thanks for correcting what I misunderstood. Absolutely agree with what you mentioned about the “multiple endpoint” issue in this topic.