Gonzalo pointed me to a paper by Michael Hout, Laura Mangels, Jennifer Carlson, and Rachel Best at Berkeley that points out some systematic differences between election outcomes in e-voting and non-e-voting counties in Florida. To jump to the punch line: they have found an interesting pattern, which closer study suggests arises from just two of the e-voting counties: Broward and Palm Beach, which unexpectedly swung about 3% toward Bush in 2004. They also make some pretty strong causal claims which I would think should be studied further, but with some skepticism.
Pretty pictures
Before getting to a discussion of this paper, let me show you a few pictures (adapted from an analysis performed Bruce Shaw here at Columbia).
First, a scatterplot of the counties in Florida, displaying the change in the Republican vote percentage from 2000 to 2004, plotting vs. the Republican vote percentage in 2000 (in both cases, using the Republican % of the two-party vote). Red circles indicate the counties that used e-voting in 2000, and black circles used optical scans. The radius of each circle is roughly proportional to the log of the #votes in the county.

There are three obvious patterns in the figure:
1. The e-voting counties, especially the largest of them, were more Democrat-leaning.
2. For the optical scan counties, there was a consistent trend that the counties that favored Bush more in 2000, tended to move even more toward Bush in 2000.
3. For the e-voting counties, no such trend is apparent. In particular, the two large red circles on the left of the plot (Broward and Palm Beach) moved strongly toward the Republicans.
Next: looking at previous years, and commenting on the Hout et al. paper.
Looking at previous years
A natural question when looking at the above picture is: is this something new (possibly related to e-voting), or is it just a persistent pattern within these particular counties?
Here is the same picture, but plotting the change from 1996 to 2000 vs. the vote in 1996. (In this graph, we’re using the same color scheme as in our 2004 plots. That is, red indicates counties that used e-voting in 2004.)

And now 1992 to 1996:

And now 1988 to 1992:
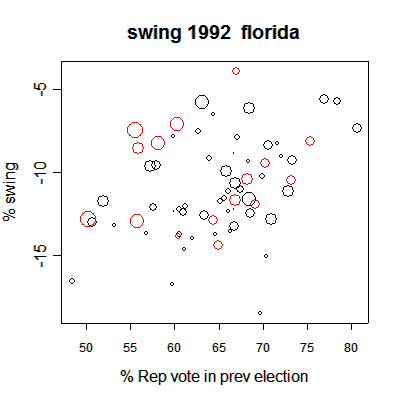
Interesting…the pattern we saw in 2004 did not seem to happen in previous elections. However, other years have their own idiosycratic features (see the 1996 plot).
Cheating?
Something unusual seems to have happened in Broward and Palm Beach counties in 2004. One possibility, as suggested by Hout et al., is cheating, possibly set up ahead of time (e.g., by loading extra votes into the machines before the election or by setting it up to switch or not count some votes). This explanation makes a certain amount of sense, in that, if someone wanted to cheat ahead of time, it would make sense to do it in Florida, and it would make sense to do it in the large-population counties where a 5%-or-so swing in votes could make a difference in the statewide total.
A glance at the first graph above makes it clear that the swings-toward-Bush-that-don’t-fit-the-general-pattern-in-the-state are a feature just of Broward and Palm Beach counties–not of all the e-voting counties. If you remove the two big red circles from the left of the plot, there doesn’t seem to be much going on.
Just plain voting?
Two counties explain all the difference. I don’t know what was going on in these counties, what else was on the ballot, etc., but an obvious alternative explanation is that, for various reasons, 3% more people in those counties preferred Bush in 2004, compared to 2000. As can be seen in the graphs above for 2000, 1996, and 1992, such a swing would be unusual (at least compared to recent history), but that doesn’t mean it couldn’t happen!
Comment on the Hout et al. paper
The a paper by Hout et al. raises some interesting questions about differences between e-voting and optical scan counties in Florida. They are mostly careful to distinguish between correlation and causation; for example, in their a bstract, they refer to “the association between electronic voting and increased support for President Bush” [emphasis added]. However, in one place in their article, they are a little sloppy and imply causation: “Electronic voting raised President Bush’s advantage from the tiny edge he held in 2000 to a clearer margin of victory in 2004.”
More relevantly, especially for the prospect of studying this further, the only anomalies appear in Broward and Palm Beach counties (the most Democrat-leaning of the e-voting counties), at least as far as we can see in our first scatterplot above. Thus, although Hout et aal. perform regressions using “e-voting” as their predictor, it would make sense to focus study on these two counties. (They write that the “impact [of e-voting] was proportional to the Democratic support in the county,” but we only see discrepancies in those two counties, not in the others. Conversely, they find a “slightly
negative effect in the counties where Mr. Bush did the best in 2000”, suggesting that e-voting actually helped Kerry in some counties, but that claim seems clearly to be an artifact of their regression model.) Of course, we only look at vote in 2000, and their regression analysis controls for other things, but I doubt our conclusions would change much by adding in those other predictors.
Conclusion (so far)
It would make sense to look further at Broward and Palm Beach counties, where swings happened which look unexpected compared to the other counties and compared to 2000, 1996, and 1992. But lots of unexpected things happen in elections, so we shouldn’t jump to the conclusion that e-voting is related to these particular surprises.
Boris commented:
Andy,
You write "3. For the e-voting counties, no such trend is apparent. In particular, the two large red circles on the left of the plot (Broward and Palm Beach) moved strongly toward the Republicans."
I think you should write "move toward the Republicans" since 'strong' implies a large move relative to the other counties, which didn't happen.
Isn't it also the case that Bush did much better than he did in 2000 in virtually all counties across the US? He gained votes in MASSACHUSETTS, for heaven's sake! So gaining votes in Palm Beach and Broward shouldn't be too surprising. More surprising would be an elaborate cheating campaign.
Of course, the undetectability of cheating is even more even evidence of its existence … That Rove, so devious …
Andrew commented:
Boris,
Yes, I agree with you completely. The 3% swings look a little unusual in the context of the graph for 2004 but are certainly nothing "strong" from a historical standpoint.
The point of my post is that, if the Hout et al. article is taken as evidence of funny business, the place to look would be in those particular two counties. I completely agree that the the default explanation has got to be that a bunch of people in those counties simply decided they wanted to vote for Bush. It's a big jump from a statistical pattern to a claim of fraud, and I'm certainly in no position to evaluate that jump.
Andrew commented:
One other thing… if county-by-county exit polls were available, one could compare them to the election results. If there really were cheating in Broward and Palm Beach counties, one would expect to see an extra 5% or so discrepancy from the exit polls there.
Alex commented:
Unfortunately, I think the Berkley study is flawed. It does not account for the increase of Republican voters between 2000 and 2004. See
http://alex.strashny.com/2004/11/electronic_votin…
Wondering your reaction about recent changes in (e-)voting systems. Seems like no lessons had been learned (yet).