There’s been some debate in the media and among social scientists about the relation between income and voting. On one hand, the states that support the Democrats–the so-called “blue states”–are richer, on average, than the Republican-leaning “red states.” On the other hand, richer voters continue to support the Republicans–not so much as an economic determinst might suspect (even in the lowest income category, Bush in 2004 still got 36% of the vote) but the correlation is there.
Awhile ago, we made this plot, which shows how the Republicans can simultaneously have the support of poor states, and richer voters within states:

Mississippi is the poorest state, Ohio is in the middle, and Connecticut is the richest state. Within each state, the line shows the probability of supporting Bush for President for each of five income categories, and the five open circles represent the relative proportion of adults in that state in each category. The black circles show the average income and probability of supporting Bush for each state.
The above plot was fit with a model (a varying-intercept logistic regression) that restricted the slopes in the states to be essentially parallel. We then expanded the model to allow the slopes to vary also, so that the coefficient for income could differ in richer or poorer states. The figure below shows the result:
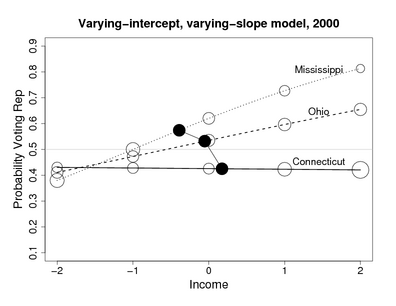
Income clearly matters much more in “red states” like Mississippi than in “blue states” like Connecticut. We also see this pattern in 2004, and somewhat in 1992 and 1996, but not really before the 90s.
My talk at George Mason University
I spoke on this last week at the economics department at George Mason University (at the invitation of Alex Tabarrok). Here are the slides. (We’re still finishing up the paper and will post it soon.)
The audience was lively and raised many good points. One thing they emphasized is that, although the relation between income and vote preference is there, it is much weaker than one might expect based on an economic-determinism argument. I think that our second graph (above) helps focus this point: voting in Mississippi is much closer to economically-determined than voting in Connecticut, with states like Ohio somewhere in between. The other comment they made was that income is correlated with demographic-type variables such as ethnicity, education, and church attendance, and so a correlation between income and Republican voting shouldn’t be interpreted as a causal effect. I defnitely agree with that comment but defended our analysis by saying that we actually are interested in the descriptive patterns. Who are these Democrats, and who are these Republicans? I’ve learned something by finding that there are big income gaps between Democrats and Republicans in the red states, not so much in the blue states. This finding is interesting in itself, because it’s important to have a sense of who are the supporters of different political candidates and parties.
Finally, I had some arguments from cognitive psychology for why journalists could be confused about the red/blue patterns. (See near the end of the slides, also this blog entry on the second-order availability bias.) The audience wasn’t convinved about my application of psychology research to this problem. I don’t think they thought I was wrong, they just weren’t convinced. Which is fair–I just wanted to present a reasonable explanation. The main thing is that, without multilevel modeling, it would be hard to see these patterns at all. When journalists (and social scientists) look at poll data, they tend to see just one aspect at a time (for example, journalists seeing the differences between states, and social scientists running regressions on demographic predictors). When only seeing part of the data, it is easier to inappropriately generalize.
Just for fun . . .
Here’s one more plot, raw data from 2000 and 2004 exit polls (thanks to Bob Shapiro for pointing me to the data):

What are the Gini-like measures of income and net worth for these three states?
Andrew, what package do you use to create such wonderful slides? I'm presenting the paper here at Harris in a few weeks.
Chris,
I don't know the details–Boris did this part of the analysis.
Boris,
Beamer. It's a latex class. Jouni told me about it.
Try controlling for race. I suspect you have at least partially a lurking variable muddying up your main effect.
Andrew N.,
We did an analysis excluding African-Americans and got similar results. (The graphs are in the paper which we are currently revising.)
Do you have a map of America showing red and blue areas?
could you kindly email this to me?
Thank you, Rayla Star
Having lived in CT my whole life I can tell you that the Dems get the minority voters and and a good amount of union workers but they get a lot of high income workers too. The high cost of living tends to make people think they aren't doing so well and they vote dem. Somebody making 6 figures in a town where the average house is a million dollars doesn't think of himself as rich. He might even think he is part of a shrinking middle class. On the other hand the state has "rural" communities that are similar to the red states that vote republican. You also have lower and middle class eastern european immigrants who like the republican party. You also have "social liberals" that vote for the dems in the national elections but will vote for Jody Rell or local republicans. One statistic that would be interesting to check out would be the state that leads in split couples. I wouldn't be surprised to see CT, or NJ at the top of that list.
Perhaps you also have a threshold effect: once people reach a certain level of income (e.g. Connecticut), the extend of economic determinism in voting patterns falls away.
Threshold effects are always a pain to deal with in statistics.