A colleague and ran into a problem for which we felt compelled to fit a sophisticated model, or at least a complicated one, just to perform an exploratory data analysis.
The data are measurements of the “leakiness” of various commercial buildings: if you pressurize them to a particular level compared to the outdoors, how much air escapes? Enormous fans are used to pressurize the building, and the amount of flow that the fans provide in order to attain a given pressure drop is recorded. Data come from various countries (US, SWEDen, FRAnce, etc.), various categories of buildings (EDUcational, OFFice, WAREhouse, etc.), and various construction types (MASonry, METal frame, TILT-up, etc.) We also know how tall the building is (in number of floors), and we know the approximate building footprint, and sometimes a few other things like the age of the building.
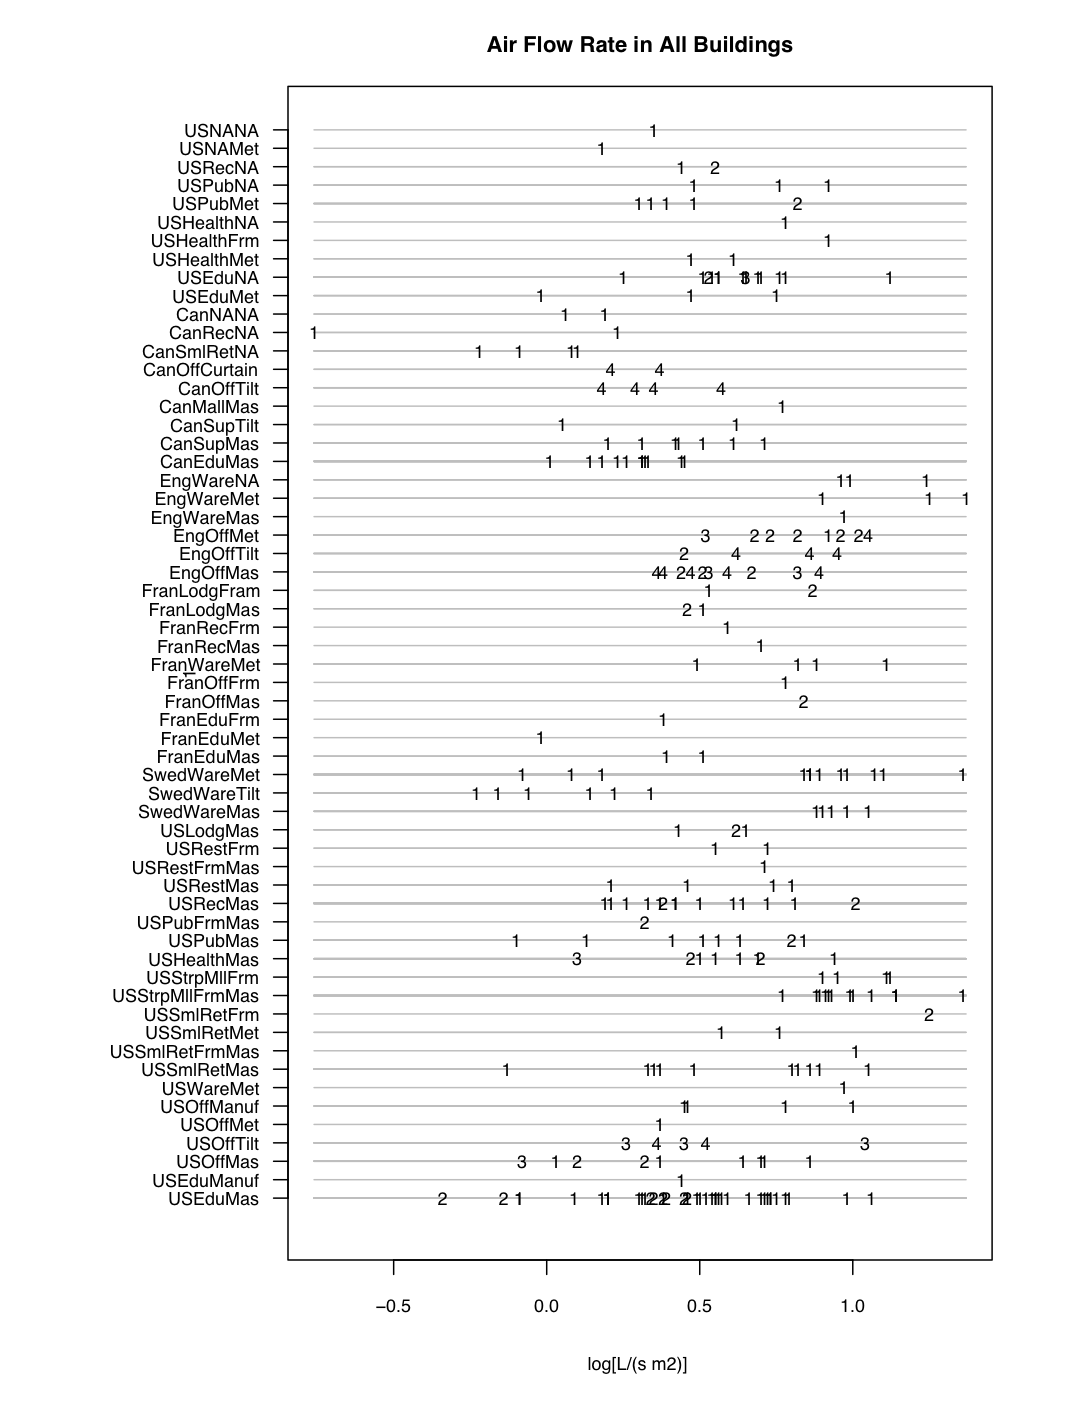
This figure shows the log (base 10) of the leakiness, in liters per second per square meter of building shell, at a 50 Pascal pressure differential, for each building, grouped by country/category/construction, and using different digits to indicate the height of the building (1 = single story, 2 = 2-3 stories, 3 = 4-5 stories, and 4 = 6 or more stories).
We can’t hope to extract anything conclusive from this dataset, or at least anything conclusive concerning the larger building stock that we are interested in, because the buildings do not constitute a representative sample. They are largely a “convenience sample” of buildings that were located near the workplaces of the researchers who performed the measurements, and that were willing to participate in the measurements (perhaps motivated by lack of satisfaction due to draftiness or high heating or cooling expenses). Really we just want to see if there are any trends that stand out: does it look like masonry buildings might be leakier or tighter than metal-frame buildings, does it look like tall buildings might be leakier or tighter than short ones, and so on.
Simple exploratory, such as box plots of leakiness against construction type, or plots of leakiness against height using different symbols for different construction types, are OK, but there’s enough structure in the data that no univariate or bivariate plot or model is adequate to give even a cursory overview of the questions we care about. For example, buildings in England seem to be leakier than most of the buildings from other countries, but then, the measured English buildings are also much taller than most of the others…and many of them are metal ofice buildings, a category that is absent or sparse from the other countries…but there are metal warehouses (leaky) in other countries, so maybe there is no “England effect” but instead there’s a “metal frame” effect…but…
The point is that, never mind what is the situation in the building stock as a whole, it’s a challenge just to see in a general way what is happening with the data.
If we had more data we would use ordinary linear regression, with indicator variables for country and building type and so on, and either categorical or continuous variables for height and footprint size. But this leads to very bad problems with overfitting.
So even though it seems like overkill for our small, non-representative dataset, we used BUGS to fit a Bayesian hierarchical model that includes country effects, category effects, and construction type effects. This way we could at least see that there is some systematic variation in the data: building usage category has moderate effects (schools and public assembly buildings are a bit on the tight side, warehouses are leaky) and that there is not much variation with construction type (metal frame versus masonry, etc.)…exactly the opposite of what we would have expected, by the way.
The point — and I do have one! — is that when modeling tools are functional enough, analyses that used to be reserved for the “final analysis” can be used for exploration. Back before calculators and computers, I presume that even ordinary linear regression was rarely performed: all those paper-and-ink calculations, how often would you want to go through that? But now we might routinely perform dozens of linear regressions in the first few hours of looking a dataset: predict y from x1, y from x2, y from a linear combination of x1 and x2, predict a transformed value of y from categorical variables based on x1 and x2, and so on. Now, better tools are letting us shift more complicated models into the “routine exploration” stage. That’s a very good thing.
Phil,
Would it help to batch and order the rows in your display?
Andrew: It would, indeed, be good practice to batch and order the rows in the display. Indeed, had I not uploaded the wrong file, that’s what you would see. (Ordered by country, and by building category within country, and by construction type within building type).
However, I’m not going to switch files now now because (1) I’m lazy, (2) that would render these comments meaningless to future viewers, so they would miss the accidental lessons here (by which I mean the lesson that ordering is important, and the lesson to be sure to upload the right file), and (3) although choosing a reasonable order is a good practice that should always be followed, it doesn’t actually help much in this case: within each country there are different mixes of building type and activity category, so direct comparisons are still hard. And there’s not much room to use spacing to set certain batches apart.
That said, there’s no question that graphical improvements (other than re-ordering) could be made to this plot — using different colors to set off the different construction materials or building types, for example.
One of the techniques I’ve used extensively in my practice is Symbolic Regression for variable selection, inspired mainly by Castillo et al 2003, and the papers of her colleagues at Dow (Kotanchek, Smits, Cordon, etc).
Essentially we use genetic programming to develop a database of a few thousand symbolic regression models of the data, over a diverse range of model complexity. Then we mine that database to discover common variables and low-level transformations, such as log transforms and ratios. Then we undertake a second-tier modeling phase with that subset of the variables.
And if (like we do) you use a strongly-typed flavor of GP for the symbolic regression, you can use of untransformed categorical variables as readily as you can the numerical variables.
Point being: the technique typically fits between 10000 and 500000 models to the data, and then builds meta-models on top of the resulting database. Not calculator-and-sliderule stuff, but also a matter of a few hours of overnight computing, and an hour or so of thoughtful musing when looking at the reports….
Since I have to deal with a very similar problem, I feel like I have to share my thoughts about approaching it (be it right or wrong, and hoping for some feedback).
My suggestion would be to re-classify the samples somehow. For example, via applying a multivariate eigenanalysis technique on the sample-by-property matrix and cluster the samples in the resulting reduced space. My idea is: if natural sample-clusters emerge, then these may be used as a simple "synthetic factor" in a further ANOVA.
Spineplots and linking should show the univariate associations you mention. Some form of mosaic plot could be very effective for looking for more complex associations in this dataset. If you send me the data I'll have a go.