Most academic research employs basic variables that are then correlated or regressed on with outcomes of interest. These basic variables are, for example, income, state and similar. Using such variables we can claim that, on average, urban dwellers vote for Democrats and that rural dwellers vote for Republicans. Moreover, we can claim that the rich tend to vote for Republicans and the poor for Democrats. We also know that urban dwellers on average make more money than rural dwellers. To resolve the dilemma is to form a categorical variable that combines the information from both area and income, thus avoiding the need to tackle the interaction.
While one could conceive ad hoc variables such as urban poor/rich, rural poor/rich, a better answer is in making use of segmentations developed primarily for marketing purposes. Here is a visualization of the Mosaic demographic groups and types:
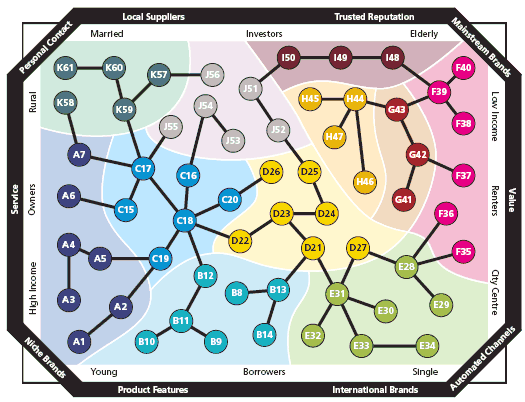
The groups are: A – symbols of success, B – happy families, C – suburban comfort, D – ties of community, E – urban intelligence, F – welfare borderline, G – municipal dependency, H – blue collar enterprise, I – twilight subsistence, J – grey perspectives, K – rural isolation. The types with much detail can be found in MS Word document – sociologists, do take a look. Another interesting segmentation is
PRIZM, which is also linked to ZIP codes in the US.
Some people might scoff at replacing a continuous variable with a categorical one, but remember that we can easily include also the original continuous variables in addition to the categorical type. Interactions between continuous variables are usually messy in most regression models anyway.
I really wonder what one would get correlating these descriptors to outcomes of interest, perhaps political preferences. Since these typologies are used by the media and marketing, we can expect to see opinion clustering in the political spectrum too.