I wrote here here that the red/blue map was not redrawn; it was more of a national partisan swing. This raises the question of what a nonuniform swing would look like.
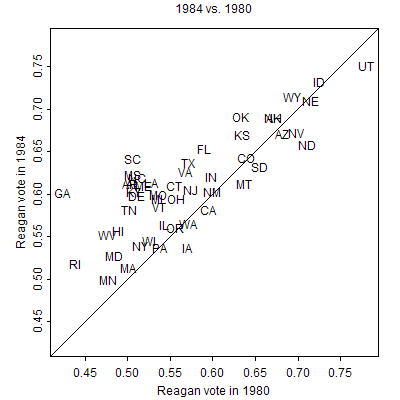
Here’s Ronald Reagan’s share of the two-party vote in 1980 and 1984, by state:

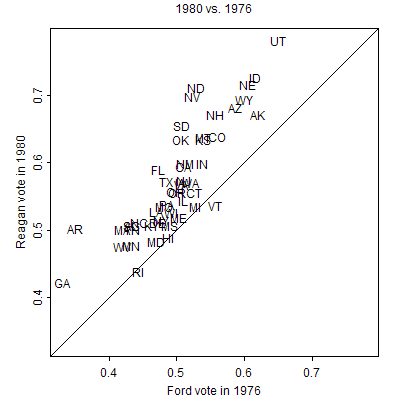
And here’s the swing from 1976 to 1980:

The average swing in each of these years was about the same as from 2004 to 2008, but, comparing the states, it was a lot less uniform.