Stan class at NYR Conference in July (in person and virtual)

I (Jonah) am excited to be teaching a 2-day Stan workshop preceding the NYR Conference in July. The workshop will be July 11-12 and the conference July 13-14.  The focus of the workshop will be to introduce the basics of applied Bayesian data analysis, the Stan modeling language, and how to interface with Stan from R. Over the course of two full days, participants will learn to write models in the Stan language, run them in R, and use a variety of R packages to work with the results.

There are both in-person and remote spots available, so if you can’t make it to NYC you can still participate. For tickets to the workshop and/or conference head to https://rstats.ai/nyr.

P.S. In my original post I forgot to mention that you can use the discount code STAN20 to get 20% off tickets for the workshop and conference!


Time Series Forecasting: futile but necessary. An example using electricity prices.

This post is by Phil Price, not Andrew.

I have a client company that owns refrigerated warehouses around the world. A refrigerated warehouse is a Costco-sized building that is kept very cold; 0 F is a common setting in the U.S. (I should ask what they do in Europe). As you might expect, they have an enormous electric bill — the company as a whole spends around a billion dollars per year on electricity — so they are very interested in the cost of electricity. One decision they have to make is: how much electricity, if any, should they purchase in advance? The alternative to purchasing in advance is paying the “real-time” electricity price. On average, if you buy in advance you pay a premium…but you greatly reduce the risk of something crazy happening. What do I mean by ‘crazy’? Take a look at the figure below. This is the monthly-average price per Megawatt-hour (MWh) for electricity purchased during the peak period (weekday afternoons and evenings) in the area around Houston, Texas. That big spike in February 2021 is an ice storm that froze a bunch of wind turbines and also froze gas pipelines — and brought down some transmission lines, I think — thus leading to extremely high electricity prices. And this plot understates things, in a way, by averaging over a month: there were a couple of weeks of fairly normal prices that month, and a few days when the price was over $6000/MWh.

Monthly-mean peak-period (weekday afternoon) electricity price, in dollars per megawatt-hour, in Texas.

If you buy a lot of electricity, a month when it costs 20x as much as you expected can cause havoc with your budget and your profits. One way to avoid that is to buy in advance: a year ahead of time, or even a month ahead of time, you could have bought your February 2021 electricity for only a bit more than electricity typically costs in Texas in February. But events that extreme are very rare — indeed I think this is the most extreme spike on record in the whole country in at least the past thirty years — so maybe it’s not worth paying the premium that would be involved if you buy in advance, month after month and year after year, for all of your facilities in the U.S. and Europe. To decide how much electricity to buy in advance (if any) you need at least a general understanding of quite a few issues: how much electricity do you expect to need next month, or in six months, or in a year; how much will it cost to buy in advance; how much is it likely to cost if you just wait and buy it at the time-of-use rate; what’s the chance that something crazy will happen, and, if it does, how crazy will the price be; and so on.

Continue reading

Summer internships at Flatiron Institute’s Center for Computational Mathematics

[Edit: Sorry to say this to everyone, but we’ve selected interns for this summer and are no longer taking applications. We’ll be taking applications again at the end of 2022 for positions in summer 2023.]

We’re hiring a crew of summer interns again this summer. We are looking for both undergraduates and graduate students. Here’s the ad.

I’m afraid the pay is low, but to make up for it, we cover travel, room, and most board (3 meals/day, 5 days/week). Also, there’s a large cohort of interns every summer across the five institutes at Flatiron (biology, astrophysics, neuroscience, quantum physics, and math), so there are plenty of peers with whom to socialize. Another plus is that we’re in a great location, on Fifth Avenue just south of the Flatiron Building (in the Flatiron neighborhood, which is a short walk to NYU in Greenwich Village and Google in Chelsea as well as to Times Square and the Hudson River Park).

If you’re interested in working on stats, especially applied Bayesian stats, Bayesian methodology, or Stan, please let me know via email at [email protected] so that I don't miss your application. We have two other Stan devs here, Yuling Yao (postdoc) and Brian Ward (software engineer).

We're also hiring full-time permanent research scientists at both the junior level and senior level, postdocs, and software engineers. For more on those jobs, see my previous post on jobs at Flatiron. That post has lots of nice photos of the office, which is really great. Or check out Google's album of photos.

The Tampa Bay Rays baseball team is looking to hire a Stan user

Andrew and I have blogged before about job opportunities in baseball for Stan users (e.g., here and here) and here’s a new one. This time it’s the Tampa Bay Rays who are hiring. The job title is “Analyst, Baseball Research & Development” and here are the responsibilities and qualifications:

Responsibilities:
* Build customized statistical modeling tools for accurate prediction and inference for various baseball applications.
* Provide statistical modeling expertise to other R&D Analysts.
* Optimize code to ensure quick and reliable model sampling/optimization.
* Author both technical and non-technical internal reports on your work.

Qualifications:
* Experience with Stan or other probabilistic programming language
* Experience with R or Python
* Deep understanding of the fundamentals of Bayesian Inference, MCMC, and Autocorrelation/Time Series Modeling.
* Start date is flexible. For example, candidates with an extensive amount of remaining time left in an academic program are encouraged to apply immediately.
* Candidates with non-traditional schooling backgrounds, as well as candidates with Advanced degree (Masters or PhD) in Statistics, Data Science, Machine Learning, or a related field are encouraged to apply

That’s just part of the job ad, so I recommend checking out the full posting, which includes important details like the fact that remote work is a possibility.

Here are a few other details I can share that aren’t included in the job ad:

  • The Rays have already been using Stan for years now so you won’t be the only Stan user there.
  • A few years ago a few of us (Stan developers) did some consulting/training work for the Rays and had a great experience. Some of their R&D team members have changed since then but I still know some of the ones there and I highly recommend working with them if you’re interested in baseball.
  • The Rays always have one of the lowest payrolls for their roster and yet they are somehow consistently competitive (they even made the World Series last year!). I’m sure there are multiple reasons for this, but I strongly suspect that the strength of the R&D team you’d be joining is one of them.


StanConnect 2021: Call for Session Proposals

Back in February it was decided that this year’s StanCon would be a series of virtual mini-symposia with different organizers instead of a single all-day event. Today the Stan Governing Body (SGB) announced that submissions are now open for anyone to propose organizing a session. Here’s the announcement from the SGB on the Stan forums: 

Following up on our previous announcement, the SGB is excited to announce a formal call for proposals for StanConnect 2021.

StanConnect is a virtual miniseries that will consist of several 3-hour meetings/mini-symposia. You can think of each meeting as a kind of organized conference “session.”

  • Anyone can feel free to organize a StanConnect meeting as a “Session Chair”. Simply download the proposal form as a docx, fill it out, and submit to SGB via email ([email protected]) by April 26, 2021 (New York) . The meeting must be scheduled for sometime this year after June 1.
  • The talks must involve Stan and be focused around a subject/topic theme. E.g. “Spatial models in Ecology via Stan”.
  • You will see that though we provide a few “templates” for how to structure a StanConnect meeting, we are trying to avoid being overly prescriptive. Rather, we are giving Session Chairs freedom to invite speakers related to their theme and structure the 3-hr meeting as they see fit.
  • If you have any questions, please feel free to post here.

I wasn’t involved in the decision to change the format but I really like the idea of a virtual miniseries. I thought the full day StanCon 2020 was great, but one nearly 24-hour global virtual conference feels like enough. And hopefully having a bunch of separately organized events will give more people a chance to get involved with Stan, either as an organizer, speaker, or attendee. 

Stan’s Within-Chain Parallelization now available with brms

The just released R package brms version 2.14.0 supports within-chain parallelization of Stan. This new functionality is based on the recently introduced reduce_sum function in Stan, which allows to evaluate sums over (conditionally) independent log-likelihood terms in parallel, using multiple CPU cores at the same time via threading. The idea of reduce_sum is to exploit the associativity and commutativity of the sum operation, which allows to split any large sum into many smaller partial sums.

Paul Bürkner did an amazing job to enable within-chain parallelization via threading for a broad range of models as supported by brms. Note that currently threading is only available with the CmdStanR backend of brms, since the minimal Stan version supporting reduce_sum is 2.23 and rstan is still at 2.21. It may still take some time until rstan can directly support threading, but users will usually not notice any difference between either backend once configured.

We encourage users to read the new threading vignette in order to get an intuition of the new feature as to what speedups one can expect for their model. The speed gain by adding more CPU cores per chain will depend on many model details. In brief:

  • Stan models taking days/hours can run in a few hours/minutes, but models running just a few minutes will be hard to accelerate
  • Models with computationally expensive likelihoods will parallelize better than those with cheap to calculate ones like a normal or a Bernoulli likelihood
  • Non-Hierarchical and hierarchical models with few groupings will greatly benefit from parallelization while hierarchical models with many random effects will gain somewhat less in speed

The new threading feature is marked as „experimental“ in brms, since it is entirely new and there may be a need to change some details depending on further experience with it. We are looking forward to hear from users about their stories when using the new feature at the Stan Discourse forums.

New Within-Chain Parallelisation in Stan 2.23: This One‘s Easy for Everyone!

What’s new? The new and shiny reduce_sum facility released with Stan 2.23 is far more user-friendly and makes it easier to scale Stan programs with more CPU cores than it was before. While Stan is awesome for writing models, as the size of the data or complexity of the model increases it can become impractical to work iteratively with the model due to too long execution times. Our new reduce_sum facility allows users to utilise more than one CPU per chain such that the performance can be scaled to the needs of the user, provided that the user has access to respective resources such as a multi-core computer or (even better) a large cluster. reduce_sum is designed to calculate in parallel a (large) sum of independent function evaluations, which basically is the evaluation of the likelihood for the observed data with independent contributions as applicable to most Stan programs (GP problems would not qualify though).

Where do we come from? Before 2.23, the map_rect facility in Stan was the only tool enabling CPU based parallelisation. Unfortunately, map_rect has an awkward interface since it forces the user to pack their model into a set of weird data structures. Using map_rect often requires a complete rewrite of the model which is error prone, time intensive, and certainly not user-friendly. In addition, chunks of works had to be formed manually leading to great confusion around how to „shard“ things. As a result, map_rect was only used by a small number of super-users. I feel like I should apologise for map_rect given that I proposed the design. Still, map_rect did drive some crazy analyses with up to 600 cores!

What is it about? reduce_sum leverages the fact that the sum operation is associative. As a consequence, we can break a large sum of independent terms into an arbitrary number of partial sums. Hence, the user needs to provide a “partial sum” function. This function must follow conventions that allow it to evaluate arbitrary partial sums. The key to user-friendliness is that the partial sum function allows an arbitrary number of additional arguments of arbitrary structure. Therefore, the user can naturally formulate their model as no awkward packing/unpacking is needed. Finally, the actual slicing into smaller partial sums is performed in full automation which automatically tunes the computational task to the given resources.

What can users expect? As usual, the answer is „it depends“. Great… but on what? Well, first of all we have to account for the fact that we do not parallelise the entire Stan program, but only a fraction of the total program is run in parallel. The theoretical speedups in this case are described by Amdahl‘s law (plot is taken from the respective Wikipedia page)

AmdahlsLaw

You can see that only when the fraction of the parallel task is really large (beyond 95%), then you can expect very good scaling of the performance up to many cores. Still, doubling the speed is easily done for most cases with just 2-3 cores. Thus, users should pack as much of their Stan program into the partial sum function to increase the fraction of parallel work load – not only the data likelihood, but ideally also the calculation to get the by data record model mean value, for example. For Stan programs this will usually mean that code in the transformed parameters and model block will be moved into the partial sum function. As a bonus for doing so, we have actually observed that this will speedup your program – even when using only a single core! The reason is that reduce_sum will slice the given task into many small ones which improves the use of CPU caches.

How can users apply it? Easy! Grab CmdStan 2.23 and dive into our documentation (R / Python users may use CmdStanR / CmdStanPy – RStan 2.23 is underway). I would recommend to go over our documentation in this order:

1. A case study which adapts Richard McElreath’s intro to map_rect for reduce_sum
2. User manual introduction to reduce_sum parallelism with a simple example as well: 23.1 Reduce-Sum
3. Function reference: 9.4 Reduce-Sum Function

I am very happy with the new facility. It was a tremendous piece of work to get this into Stan and I want to thank my Stan team colleagues Ben Bales, Steve Bronder, Rok Cesnovar, and Mitzi Morris for making all of this possible in a really short time frame. We are looking forward to what our users will do with it. We definitely encourage everyone to try it out!

The current state of the Stan ecosystem in R

(This post is by Jonah)

Last week I posted here about the release of version 2.0.0 of the loo R package, but there have been a few other recent releases and updates worth mentioning. At the end of the post I also include some general thoughts on R package development with Stan and the growing number of Stan users who are releasing their own packages interfacing with rstan or one of our other packages.

Interfaces

rstanarm and brms: Version 2.17.4 of rstanarm and version 2.2.0 of brms were both released to provide compatibility with the new features in loo v2.0.0. Two of the new vignettes for the loo package show how to use it with rstanarm models, and we have also just released a draft of a vignette on how to use loo with brms and rstan for many “non-factorizable” models (i.e., observations not conditionally independent). brms is also now officially supported by the Stan Development Team (welcome Paul!) and there is a new category for it on the Stan Forums.

rstan: The next release of the rstan package (v2.18), is not out yet (we need to get Stan 2.18 out first), but it will include a loo() method for stanfit objects in order to save users a bit of work. Unfortunately, we can’t save you the trouble of having to compute the point-wise log-likelihood in your Stan program though! There will also be some new functions that make it a bit easier to extract HMC/NUTS diagnostics (thanks to a contribution from Martin Modrák).

Visualization

bayesplot: A few weeks ago we released version 1.5.0 of the bayesplot package (mc-stan.org/bayesplot), which also integrates nicely with loo 2.0.0. In particular, the diagnostic plots using the leave-one-out cross-validated probability integral transform (LOO-PIT) from our paper Visualization in Bayesian Workflow (preprint on arXiv, code on GitHub) are easier to make with the latest bayesplot release. Also, TJ Mahr continues to improve the bayesplot experience for ggplot2 users by adding (among other things) more functions that return the data used for plotting in a tidy data frame.

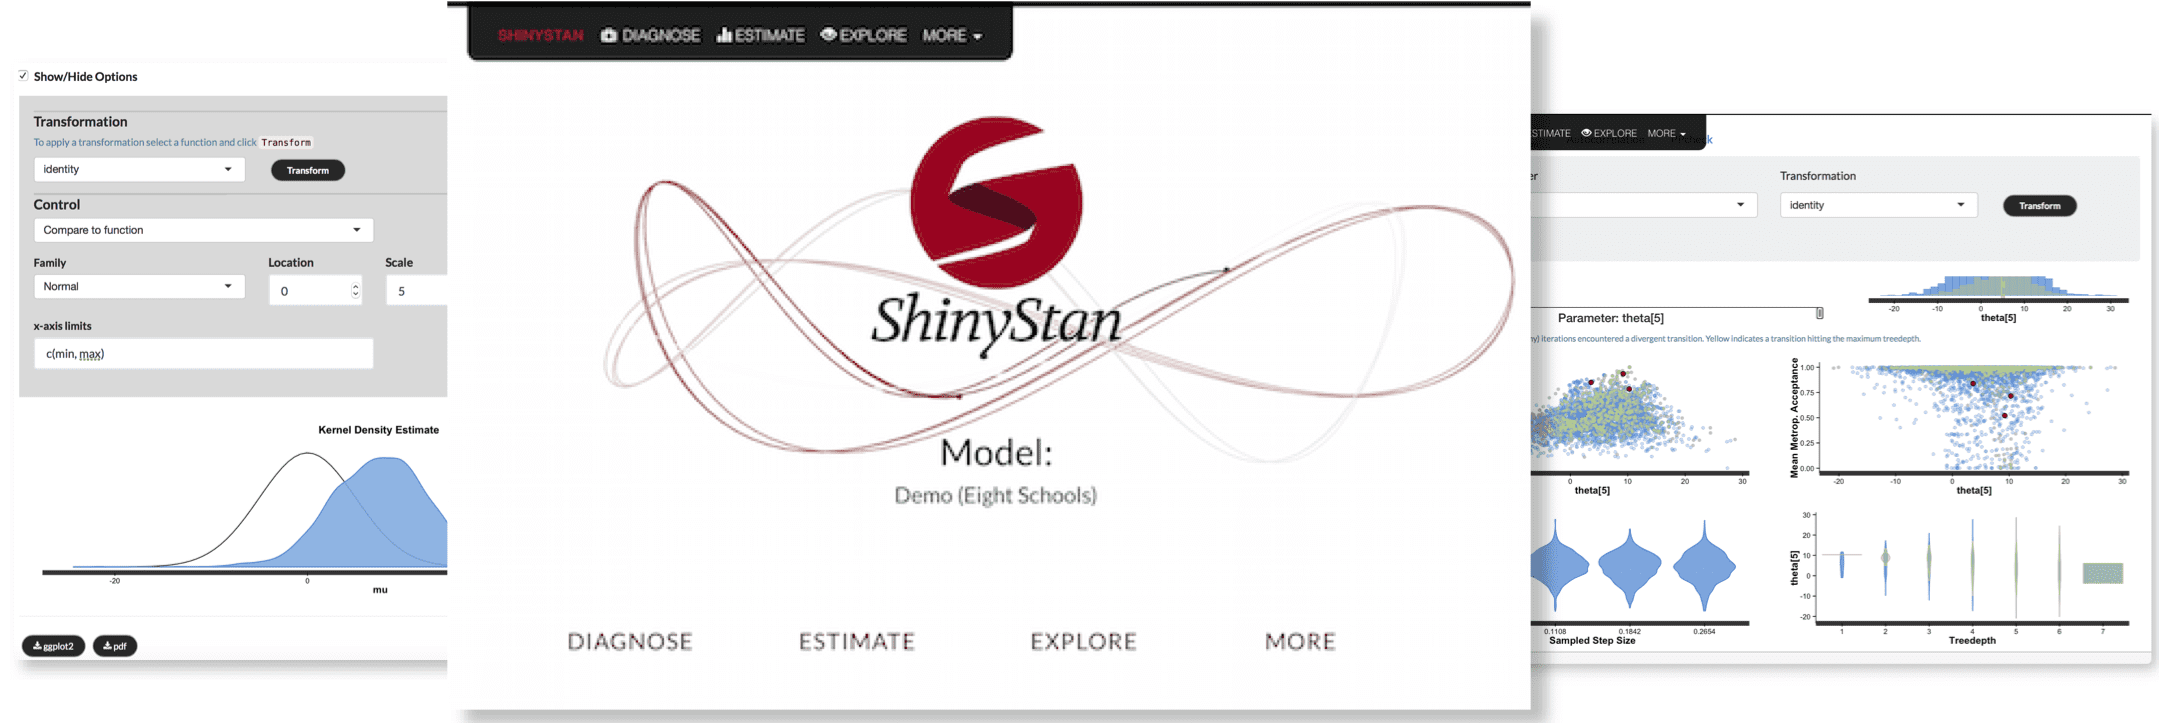
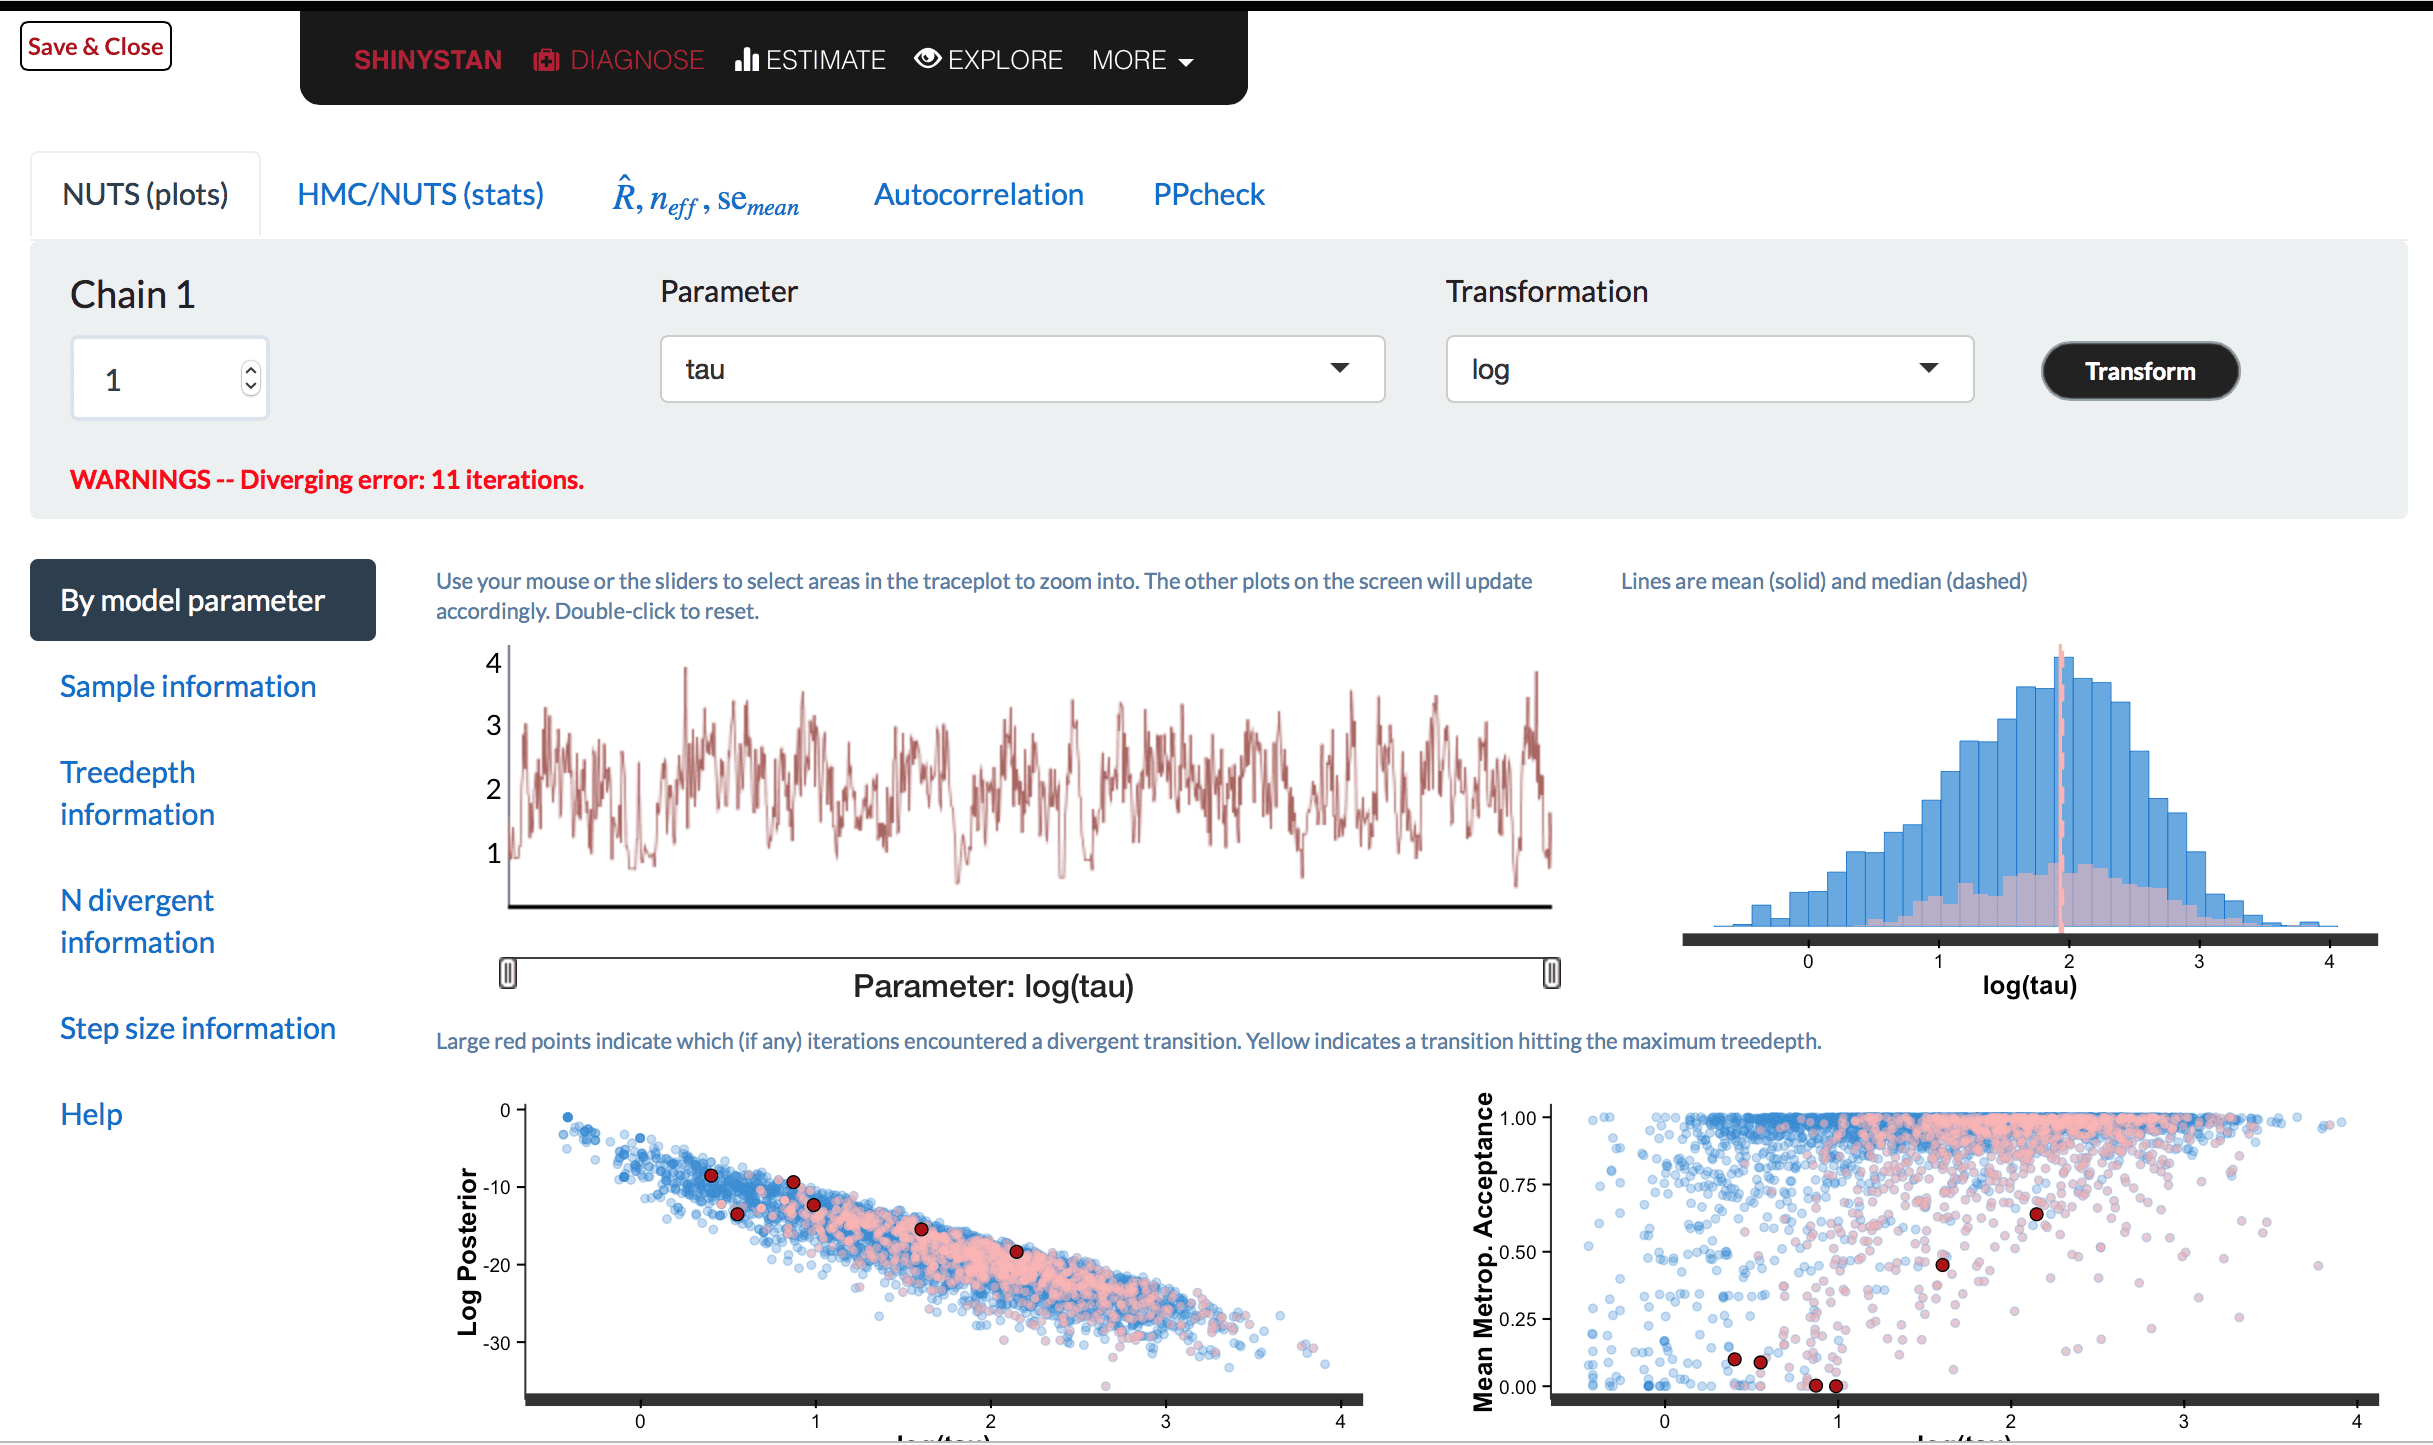
shinystan: Unfortunately, there hasn’t been a shinystan (mc-stan.org/shinystan) release in a while because I’ve been busy with all of these other packages, papers, and various other Stan-related things. We’ll try to get out a release with a few bug fixes soon. (If you’re annoyed by the lack of new features in shinystan recently let me know and I will try to convince you to help me solve that problem!)

(Update: I forgot to mention that despite the lack of shinystan releases, we’ve been working on better introductory materials. To that end, Chelsea Muth, Zita Oravecz, and I recently published an article User-friendly Bayesian regression modeling: A tutorial with rstanarm and shinystan (view).)

Other tools

loo: We released version 2.0.0, a major update to the loo package (mc-stan.org/loo). See my previous blog post.

projpred: Version 0.8.0 of the projpred package (mc-stan.org/projpred) for projection predictive variable selection for GLMs was also released shortly after the loo update in order to take advantage of the improvements to the Pareto smoothed importance sampling algorithm. projpred can already be used quite easily with rstanarm models and we are working on improving its compatibility with other packages for fitting Stan models.

rstantools: Unrelated to the loo update, we also released version 1.5.0 of the rstantools package (mc-stan.org/rstantools), which provides functions for setting up R packages interfacing with Stan. The major changes in this release are that usethis::create_package() is now called to set up the package (instead of utils::package.skeleton), fewer manual changes to files are required by users after calling rstan_package_skeleton(), and we have a new vignette walking through the process of setting up a package (thanks Stefan Siegert!). Work is being done to keep improving this process, so be on the lookout for more updates soonish.

Stan related R packages from other developers

There are now well over fifty packages on CRAN that depend in some way on one of our R packages mentioned above!  You can find most of them by looking at the “Reverse dependencies” section on the CRAN page for rstan, but that doesn’t count the ones that depend on bayesplot, shinystanloo, etc., but not rstan.

Unfortunately, given the growing number of these packages, we haven’t been able to look at each one of them in detail. For obvious reasons we prioritize giving feedback to developers who reach out to us directly to ask for comments and to those developers who make an effort to our recommendations for developers of R packages interfacing with Stan (included with the rstantools package since its initial release in 2016). If you are developing one of these packages and would like feedback please let us know on the Stan Forums. Our time is limited but we really do make a serious effort to answer every single question asked on the forums (thank you to the many Stan users who also volunteer their time helping on the forums!).

My primary feelings about this trend of developing Stan-based R packages are ones of excitement and gratification. It’s really such an honor to have so many people developing these packages based on all the work we’ve done! There are also a few things I’ve noticed that I hope will change going forward. I’ll wrap up this post by highlighting two of these issues that I hope developers will take seriously:

(1) Unit testing

(2) Naming user-facing functions

The number of these packages that have no unit tests (or very scant testing) is a bit scary. Unit tests won’t catch every possible bug (we have lots of tests for our packages and people still find bugs all the time), but there is really no excuse for not unit testing a package that you want other people to use. If you care enough to do everything required to create your package and get it on CRAN, and if you care about your users, then I think it’s fair to say that you should care enough to write tests for your package. And there’s really no excuse these days with the availability of packages like testthat to make this process easier than it used to be! Can anyone think of a reasonable excuse for not unit testing a package before releasing it to CRAN and expecting people to use it? (Not a rhetorical question. I really am curious given that it seems to be relatively common or at least not uncommon.) I don’t mean to be too negative here. There are also many packages that seem to have strong testing in place! My motivation for bringing up this issue is that it is in the best interest of our users.

Regarding function naming: this isn’t nearly as big of a deal as unit testing, it’s just something I think developers (including myself) of packages in the Stan R ecosystem can do to make the experience better for our users. rstanarm and brms both import the generic functions included with rstantools in order to be able to define methods with consistent names. For example, whether you fit a model with rstanarm or with brms, you can call log_lik() on the fitted model object to get the pointwise log-likelihood (it’s true that we still have a bit left to do to get the names across rstanarm and brms more standardized, but we’re actively working on it). If you are developing a package that fits models using Stan, we hope you will join us in trying to make it as easy as possible for users to navigate the Stan ecosystem in R.

loo 2.0 is loose

This post is by Jonah and Aki.

We’re happy to announce the release of v2.0.0 of the loo R package for efficient approximate leave-one-out cross-validation (and more). For anyone unfamiliar with the package, the original motivation for its development is in our paper:

Vehtari, A., Gelman, A., and Gabry, J. (2017). Practical Bayesian model evaluation using leave-one-out cross-validation and WAIC. Statistics and Computing. 27(5), 1413–1432. doi:10.1007/s11222-016-9696-4. (published versionarXiv preprint)

Version 2.0.0 is a major update (release notes) to the package that we’ve been working on for quite some time and in this post we’ll highlight some of the most important improvements. Soon I (Jonah) will follow up with a post about important new developments in our various other R packages.

New interface, vignettes, and more helper functions to make the package easier to use

Because of certain improvements to the algorithms and diagnostics (summarized below), the interfaces, i.e., the loo() and psis() functions and the objects they return, also needed some improvement. (Click on the function names in the previous sentence to see their new documentation pages.) Other related packages in the Stan R ecosystem (e.g., rstanarm, brms, bayesplot, projpred) have also been updated to integrate seamlessly with loo v2.0.0. (Apologies to anyone who happened to install the update during the short window between the loo release and when the compatible rstanarm/brms binaries became available on CRAN.)

Three vignettes now come with the loo package package and are also available (and more nicely formatted) online at mc-stan.org/loo/articles:

  • Using the loo package (version >= 2.0.0) (view)
  • Bayesian Stacking and Pseudo-BMA weights using the loo package (view)
  • Writing Stan programs for use with the loo package (view)

A vignette about K-fold cross-validation using new K-fold helper functions will be included in a subsequent update. Since the last release of loo we have also written a paper, Visualization in Bayesian workflow, that includes several visualizations based on computations from loo.

Improvements to the PSIS algorithm, effective sample sizes and MC errors

The approximate leave-one-out cross-validation performed by the loo package depends on Pareto smoothed importance sampling (PSIS). In loo v2.0.0, the PSIS algorithm (psis() function) corresponds to the algorithm in the most recent update to our PSIS paper, including adapting the Pareto fit with respect to the effective sample size and using a weakly informative prior to reduce the variance for small effective sample sizes. (I believe we’ll be updating the paper again with some proofs from new coauthors.)

For users of the loo package for PSIS-LOO cross-validation and not just the PSIS algorithm for importance sampling, an even more important update is that the latest version of the same PSIS paper referenced above describes how to compute the effective sample size estimate and Monte Carlo error for the PSIS estimate of elpd_loo (expected log predictive density for new data). Thus, in addition to the Pareto k diagnostic (an indicator of convergence rate – see paper) already available in previous loo versions, we now also report an effective sample size that takes into account both the MCMC efficiency and the importance sampling efficiency. Here’s an example of what the diagnostic output table from loo v2.0.0 looks like (the particular intervals chosen for binning are explained in the papers and also the package documentation) for the diagnostics:

Pareto k diagnostic values:
                         Count Pct.    Min. n_eff
(-Inf, 0.5]   (good)     240   91.6%   205
 (0.5, 0.7]   (ok)         7    2.7%   48
   (0.7, 1]   (bad)        8    3.1%   7
   (1, Inf)   (very bad)   7    2.7%   1

We also compute and report the Monte Carlo SE of elpd_loo to give an estimate of the accuracy. If some k>1 (which means the PSIS-LOO approximation is not reliable, as in the example above) NA will be reported for the Monte Carlo SE. We hope that showing the relationship between the k diagnostic, effective sample size, and and MCSE of elpd_loo will make it easier to interpret the diagnostics than in previous versions of loo that only reported the k diagnostic. This particular example is taken from one of the new vignettes, which uses it as part of a comparison of unstable and stable PSIS-LOO behavior.

Weights for model averaging: Bayesian stacking, pseudo-BMA and pseudo-BMA+

Another major addition is the loo_model_weights() function, which, thanks to the contributions of Yuling Yao, can be used to compute weights for model averaging or selection. loo_model_weights() provides a user friendly interface to the new stacking_weights() and pseudobma_weights(), which are implementations of the methods from Using stacking to average Bayesian predictive distributions (Yao et al., 2018). As shown in the paper, Bayesian stacking (the default for loo_model_weights()) provides better model averaging performance than “Akaike style“ weights, however, the loo package does also include Pseudo-BMA weights (PSIS-LOO based “Akaike style“ weights) and Pseudo-BMA+ weights, which are similar to Pseudo-BMA weights but use a so-called Bayesian bootstrap procedure to  better account for the uncertainties. We recommend the Pseudo-BMA+ method instead of, for example, WAIC weights, although we prefer the stacking method to both. In addition to the Yao et al. paper, the new vignette about computing model weights demonstrates some of the motivation for our preference for stacking when appropriate.

Give it a try

You can install loo v2.0.0 from CRAN with install.packages("loo"). Additionally, reinstalling an interface that provides loo functionality (e.g., rstanarm, brms) will automatically update your loo installation. The loo website with online documentation is mc-stan.org/loo and you can report a bug or request a feature on GitHub.

StanCon 2018 Live Stream — bad news…. not enough bandwidth

Breaking news: no live stream. We’re recording, so we’ll put the videos online after the fact.

We don’t have enough bandwidth to live stream today.


StanCon 2018 starts today! We’re going to try our best to live stream the event on YouTube.

We have the same video setup as last year, but may be limited by internet bandwidth here at Asilomar.

If we’re up, we will these YouTube events on the Stan YouTube Channel (all times Pacific):


StanCon2018 Early Registration ends Nov 10

StanCon is happening at the beautiful Asilomar conference facility at the beach in Monterey California for three days starting January 10, 2018. We have space for 200 souls and this will sell out.

If you don’t already know, Stan is the rising star of probabilistic modeling with Bayesian analysis. If you do statistics, machine learning or data science then you need to know about Stan.

StanCon offers a full schedule of invited talks, submitted papers, and tutorials unavailable in any other format. Balancing the intellectual intensity of cutting edge statistical modeling are fun activities like indoor R/C airplane building/flying/designing and non-snobby blind wine tasting for after dinner activities. We will have the first ever “wear your poster” reception–see the call for posters below. And no parallel sessions–you get the entire StanCon2018, not a slice.

Go to http://mc-stan.org/events/stancon2018 and register.

Invited Talks

  • Andrew Gelman
    Department of Statistics and Political Science, Columbia University
  • Susan Holmes
    Department of Statistics, Stanford University
  • Frank Harrell, Jr.
    School of Medicine and Department of Biostatistics, Vanderbilt University
  • Sophia Rabe-Hesketh
    Educational Statistics and Biostatistics, University of California, Berkeley
  • Sean Taylor and Ben Letham
    Facebook Core Data Science
  • Manuel Rivas
    Department of Biomedical Data Science, Stanford University
  • Talia Weiss
    Department of Physics, Massachusetts Institute of Technology

These rock stars have agreed to leave their entourages, groupies and bad habits at home and will start their shows talks on time and leave you wanting more.

Submitted talks:

We have 18 accepted talks ranging from public policy viewed through Bayesian analysis to painful theory papers. And we have Facebook, and space people from NASA. Talks are self-contained knitr or Jupyter notebooks that will be made publicly available after the conference.

Tutorials

We have tutorials that start at the crack of 8am for those desiring further edification beyond the awesome program. Total time ranges from 6 hours to 1 hour depending on topic—these will be parallel but don’t conflict with the main conference.

  • Introduction to Stan
    Know how to program? Know basic statistics? Curious about Bayesian analysis and Stan? This is the course for you. Hands on, focused and an excellent way to get started working in Stan. 2 hours every morning 8am to 10am.
  • Executive decision making the Bayesian way
    This is for nontechnical managers to learn the core of decision making under uncertainty and how to interpret the talks that they will be attending the rest of the day. 1 hour/day every day.
  • Advanced Modeling in Stan
    The hard stuff led by the best of the best. Very interactive, very intense. Varying topics, every day 1-2 hours.

Poster call for participation

We will take poster submissions on a rolling basis until December 5th. One page exclusive of references is the desired format but anything that gives us enough information to make a decision is fine. We will accept/reject within 48 hours. Send to [email protected].

The only somewhat odd requirement is that your poster must be “wearable” to the 5pm reception where you will be a walking presentation. Great way to network, signboard supplies will be available so you need only have sheets of paper which can be attached to signboard material which coincidentally will be the source airframe material for the R/C airplane activities following dinner.

Fun Stuff

Learning is fun but we anticipate that blowing off a little steam will be called for.

  • R/C Airplanes
    After dinner on day 1 we will provide designs and building materials to create your own R/C airplane. The core design can be scratch built in 90 minutes or less at which point, and weather dependent, we will learn to fly our planes indoors or outdoors. See http://brooklynaerodrome.com for an idea of the style of airplane. You can also create your own designs and we will have night illumination gear.
  • Snob-free Blind Wine Tasting
    By day 2 you will have gotten to know your fellow attendees so some social adventure is called for. This activity has proved wildly successful at DARPA conferences and they invented the internet so it can’t be all bad. Participants taste wines without knowing what they are.
    That’s it! StanCon2018 is going to be a pressure cooker of learning and fun. Don’t miss it.

Early registration

Early bird registration ends 10 November 2017.

Go to http://mc-stan.org/events/stancon2018 and register.


StanCon Organizing Committee

Stan in St. Louis this Friday

This Friday afternoon I (Jonah) will be speaking about Stan at Washington University in St. Louis. The talk is open to the public, so anyone in the St. Louis area who is interested in Stan is welcome to attend. Here are the details:

Title: Stan: A Software Ecosystem for Modern Bayesian Inference
Jonah Sol Gabry, Columbia University

Neuroimaging Informatics and Analysis Center (NIAC) Seminar Series
Friday April 28, 2017, 1:30-2:30pm
NIL Large Conference Room
#2311, 2nd Floor, East Imaging Bldg.
4525 Scott Avenue, St. Louis, MO

medicine.wustl.eduNIAC

Stan Conference Live Stream

StanCon 2017 is tomorrow! Late registration ends in an hour. After that, all tickets are $400.

We’re going to be live streaming the conference. You’ll find the stream as a YouTube Live event from 8:45 am to 6 pm ET (and whatever gets up will be recorded by default). We’re streaming it ourselves, so if there are technical difficulties, we may have to stop early.

We’re on Twitter and you can track the conference with the #stancon2017 hashtag.


StanCon: now accepting registrations and submissions

stancon2017_logo

As we announced here a few weeks ago, the first Stan conference will be Saturday, January 21, 2017 at Columbia University in New York. We are now accepting both conference registrations and submissions. Full details are available at StanCon page on the Stan website. If you have any questions please let us know and we hope to see you in NYC this January!

Here are the links for registration and submissions:

Registration

Anyone using or interested in Stan is welcome to register for the conference. To register for StanCon please visit the StanCon registration page.

Submissions

StanCon’s version of conference proceedings will be a collection of contributed talks based on interactive, self-contained notebooks (e.g., knitr, R Markdown, Jupyter, etc.). Submissions will be peer reviewed by the StanCon organizers and all accepted notebooks will be published in an official StanCon repository. If your submission is accepted we may also ask you to present during one of the StanCon sessions.

For details on submissions please visit the StanCon submissions page.


P.S. Stay tuned for an announcement about several Stan and Bayesian inference courses we will be offering in the days leading up to the conference.

StanCon is coming! Sat, 1/21/2017

[Update: There’s a more recent post with the schedule.]


Save the date! The first Stan conference is going to be in NYC in January. Registration will open at the end of September.


When:

Saturday, January 21, 2017

9 am – 5 pm


Where:

Davis Auditorium, Columbia University

530 West 120th Street

4th floor (campus level), room 412

New York, NY 10027


Registration:

Registration will open at the end of September.


Early registration (on or before December 20, 2016):

– Student: $50

– Academic: $100

– Industry: $200

This will include coffee, lunch, and some swag.


Late Registration (December 21, 2016 and on):

– Student: $75

– Academic: $150

– Industry: $300

This will include coffee and lunch. Probably won’t get swag.


Contributed talks:

We’re looking for contributed talks. We will start accepting submissions at the end of September.

The contributed talks at StanCon will be based on interactive, self-contained notebooks, such as knitr or Jupyter, that will also take the place of proceedings.  For example, you might demonstrate a novel modeling technique or a simplified version of a novel application. Each submission should include the notebook and separate files containing the Stan program, data, initializations if used, and a permissive license for everything such as CC BY 4.0.


Tentative Schedule:

8:00- 9:00 Registration / Coffee / Breakfast

9:00 – 9:20 Opening remarks

9:20 – 10:30 Session 1

10:30 – 11:00 Coffee break

11:00 – 12:30 Session 2

12:30 – 2:00 Lunch

2:00 – 3:15 Session 3

3:15 – 3:45 Coffee break

3:45 – 5:00 Session 4


Sponsorship:

We are looking for some sponsorship to either defer costs or provide travel assistance. Please email [email protected] for more information.


Organizers:

Michael Betancourt (Columbia University)

Tamara Broderick (MIT)

Jonah Gabry (Columbia University)

Andrew Gelman (Columbia University)

Ben Goodrich (Columbia University)

Daniel Lee (Columbia University)

Eric Novik (Stan Group Inc)

Lizzie Wolkovich (Harvard University)


NYC Stan meetup 12 December

The next NYC Stan meetup is on Saturday:

Feel free to bring things you’re working on or join in on projects some of the others are working on. A couple of the developers will be around to answer questions and help out.

If you don’t have anything to work on, the Stan team could use help with setting up the examples repository to be more friendly.

If you’re planning on coming, please register here.


ShinyStan v2.0.0

For those of you not familiar with ShinyStan, it is a graphical user interface for exploring Stan models (and more generally MCMC output from any software). For context, here’s the post on this blog first introducing ShinyStan (formerly shinyStan) from earlier this year.

shinystan_images

ShinyStan v2.0.0 released

ShinyStan v2.0.0 is now available on CRAN. This is a major update with a new look and a lot of new features. It also has a new(ish) name: ShinyStan is the app/GUI and shinystan the R package (both had formerly been shinyStan for some reason apparently not important enough for me to remember). Like earlier versions, this version has enhanced functionality for Stan models but is compatible with MCMC output from other software packages too.

You can install the new version from CRAN like any other package:

install.packages("shinystan")

If you prefer a version with a few minor typos fixed you can install from Github using the devtools package:

devtools::install_github("stan-dev/shinystan", build_vignettes = TRUE)

(Note: after installing the new version and checking that it works we recommend removing the old one by running remove.packages(“shinyStan”).)

If you install the package and want to try it out without having to first fit a model you can launch the app using the preloaded demo model:

library(shinystan)
launch_shinystan_demo()

Notes

This update contains a lot of changes, both in terms of new features added, greater UI stability, and an entirely new look. Some release notes can be found on GitHub and there are also some instructions for getting started on the ShinyStan wiki page. Here are two highlights:

  • The new interactive diagnostic plots for Hamiltonian Monte Carlo. In particular, these are designed for models fit with Stan using NUTS (the No-U-Turn Sampler).

    Diagnostics screenshot Diagnostics screenshotshinystan_diagnostics3

  • The deploy_shinystan function, which lets you easily deploy ShinyStan apps for your models to RStudio’s ShinyApps hosting service. Each of your apps (i.e. each of your models) will have a unique URL. To use this feature please also install the shinyapps package: devtools::install_github("rstudio/shinyapps").

The plan is to release a minor update with bug fixes and other minor tweaks in a month or so. So if you find anything we should fix or change (or if you have any other suggestions) we’d appreciate the feedback.

A Stan is Born

Stan 1.0.0 and RStan 1.0.0

It’s official. The Stan Development Team is happy to announce the first stable versions of Stan and RStan.

What is (R)Stan?

Stan is an open-source package for obtaining Bayesian inference using the No-U-Turn sampler, a variant of Hamiltonian Monte Carlo. It’s sort of like BUGS, but with a different language for expressing models and a different sampler for sampling from their posteriors.

RStan is the R interface to Stan.

Stan Home Page

Stan’s home page is: http://mc-stan.org/

It links everything you need to get started running Stan from the command line, from R, or from C++, including full step-by-step install instructions, a detailed user’s guide and reference manual for the modeling language, and tested ports of most of the BUGS examples.

Peruse the Manual

If you’d like to learn more, the Stan User’s Guide and Reference Manual is the place to start.