
The title of this post says it all. A 2% shift in public opinion is not so large and usually would not be considered shocking. In this case the race was close enough that 2% was consequential.
Here’s the background:
Four years ago, Mitt Romney received 48% of the two-party vote and lost the presidential election. This year, polls showed Donald Trump with about 48% of the two-party vote. When the election came around, Trump ended up with nearly 50% of the two-party vote—according to the latest count, he lost to Hillary Clinton by only 200,000 vote. Because of the way the votes were distributed in states, Trump won the electoral college and thus the presidency.
In this earlier post I graphed the Romney-Trump swing by state and also made this plot showing where Trump did better or worse than the polls in 2016:
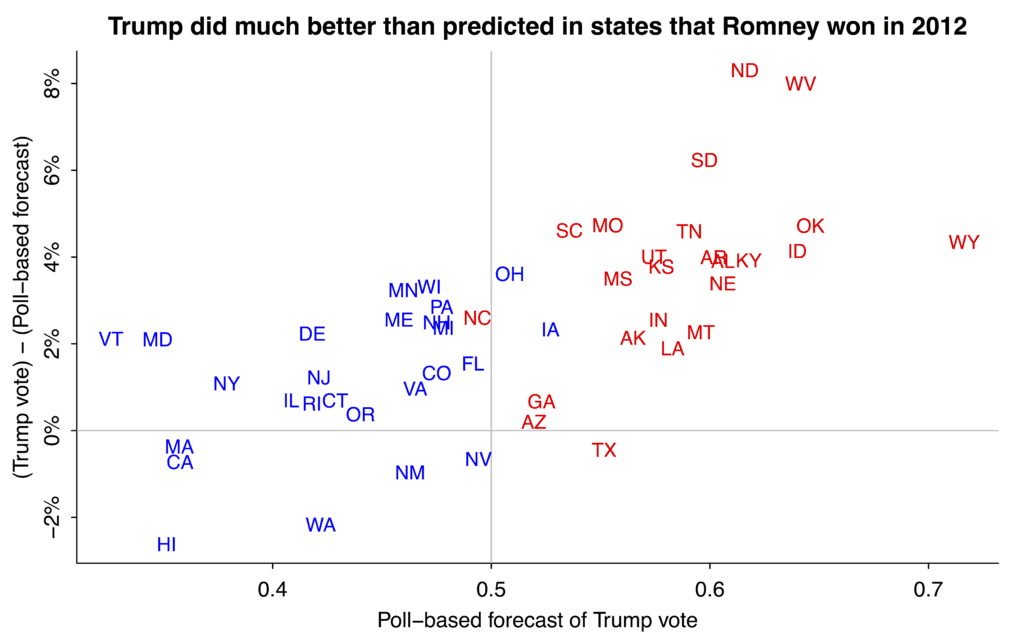
Trump outperformed the polls in several key swing states and also in lots of states that were already solidly Republican.
The quantitative pundits
Various online poll aggregators were giving pre-election probabilities ranging from 66% to 99%. These probabilities were high because Clinton had been leading in the polls for months; the probabilities were not 100% because it was recognized that the final polls might be off by quite a bit from the actual election outcome. Small differences in how the polls were averaged corresponded to large apparent differences in win probabilities; hence we argued that the forecasts that were appearing, were not so different as they seemed based on those reported odds.
The final summary is that the polls were off by about 2% (or maybe 3%, depending on which poll averaging you’re using), which, again, is a real error of moderate size that happened to be highly consequential given the distribution of the votes in the states this year. Also we ignored correlations in some of our data, thus producing illusory precision in our inferences based on polls, early voting results, etc.
What happened?
Several explanations have been offered. It’s hard at this point to adjudicate among them, but I’ll share what thoughts I have:
– Differential voter turnout. It says here that voter turnout was up nearly 5% from the previous election. Voter turnout could have been particularly high among Trump-supporting demographic and geographic groups. Or maybe not! it says here that voter turnout was down this year. Either way, the story would be that turnout was high for Republicans relative to Democrats, compared to Obama’s elections.
– Last-minute change in vote. If you believe the exit poll, Trump led roughly 48%-41% among the 14% of voters who say they decided in the past week. That corresponds to an bump in Trump’s 2-party vote percentage of approximately .14*(.48-.41)/2 = 0.005, or 1/2 a percentage point. That’s something.
– Differential nonresponse. During the campaign we talked about the idea that swings in the polls mostly didn’t correspond to real changes in vote preferences but rather came from changes in nonresponse patterns: when there was good news for Trump, his supporters responded more to polls, and when there was good news for Clinton, her supporters were more likely to respond. But this left the question of where was the zero point.
When we analyzed a Florida poll last month, adjusting for party registration, we gave Trump +1 in the state, while the estimates from the others ranged from Clinton +1 to Clinton +4. That gives you most of the shift right there. This was just one poll so I didn’t take it too seriously at the time but maybe I should’ve.
– Trump supporters not admitting their support to pollsters. It’s possible, but I’m skeptical of this mattering too much, given that Trump outperformed the polls the most in states such as North Dakota and West Virginia where I assume respondents would’ve had little embarrassment in declaring their support for him, while he did no better than the polls’ predictions in solidly Democratic states. Also, Republican candidates outperformed expectations in the Senate races, which casts doubt on the model in which respondents would not admitting they supported Trump; rather, the Senate results are consistent with differential nonresponse or unexpected turnout or opposition to Hillary Clinton.
– Third-party collapse. Final polls had Johnson at 5% of the vote. He actually got 3%, and it’s a reasonable guess that most of this 2% went to Trump.
– People dissuaded from voting because of long lines or various measures making it more difficult to vote. I have no idea how big or small this one is. This must matter a lot more in some states than in others.
I’m sure there are some other things I missed. Let me just emphasize that the goal in this exercise is to understand the different factors that were going on, not to identify one thing or another that could’ve flipped the election outcome. The election was so close that any number of things could’ve swung enough votes for that.
P.S. Two other parts of the story:
– Voter enthusiasm. The claim has been made that Trump’s supporters had more enthusiasm for their candidate. They were part of a movement (as with Obama 2008) in a way that was less so for Clinton’s supporters. That enthusiasm could transfer to unexpectedly high voter turnout, with the twist that this would be hard to capture in pre-election surveys if Trump’s supporters were, at the same time, less likely to respond to pollsters.
– The “ground game” and social media. One reason the election outcome came as a surprise is that we kept hearing stories about Hillary Clinton’s professional campaign and big get-out-the-vote operation, as compared to Donald Trump’s campaign which seemed focused on talk show appearances and twitter. But maybe the Trump’s campaign’s social media efforts were underestimated.
P.P.S. One more thing: I think one reason for the shock is that people are reacting not just to the conditional probability, Pr (Trump wins | Trump reaches Election Day with 48% of two-party support in the polls), but to the unconditional probability, Pr (Trump becomes president of the United States | our state of knowledge two years ago). That unconditional probability is very low. And I think a lot of the stunned reaction is in part that things got so far.
To use a poker analogy: if you’re drawing to an inside straight on the river, the odds are (typically) against you. But the real question is how you got to the final table of the WSOP in the first place.
Citizen participation polling may be the way to go in the future.
https://twitter.com/douglasrhess/status/796406909368750080 (Note: image should say CST, no EST.)
I don’t know where exactly that USA Today story pulled their numbers from, but CNN had the popular vote for both Clinton and Trump at just under 60 million; in 2012 both Obama and Romney cleared 60 million. So I don’t think turnout was up across the board.
Alex: they aren’t done counting votes yet. Still a lot of California/Washington to go. I’d be surprised if overall turnout ends up lower than 2012 when all is said an’ done (like, a week from now).
In 2012, California took much of November to leisurely count the vote. By the time it was finally over, Obama’s margin had swelled considerably.
I can understand the National polls being off, but how were the swing state polls so wrong? Trump never won any public poll of WI and the internal polling from both campaigns (which should be better than public polling) also had Trump losing. How did they get them, especially WI, PA, MI so wrong?
The electorate models were totally off. Gelman’s reference to the NYT article where four different groups modeled the electorate differently and got different results illustrated this. Even if all of the public and campaign pollsters had different models, they were all sufficiently similar to produce positively misleading results.
How do you model a black swan? using McRomney data?
One other thing to consider: the number of early voters who cast ballots thinking Clinton was under renewed FBI investigation with possible indictment pending.
How about the rural vs. urban effect? Maybe the polls disproportionately take people from cities and rural areas are underrepresented.
Your forthcoming analysis observed that polling errors happen, and polling averages are 2% off. Some analyses found that undecided voters may have leaned Republican, and so perhaps they broke for Trump late.
http://www.wsj.com/articles/trump-stands-to-benefit-from-high-number-of-republican-leaning-undecided-voters-1477832402
http://www.nytimes.com/2016/10/01/upshot/so-just-who-are-these-undecided-voters.html
I’d take a closer look at polling methodology, especially sample selection, response rates, and weighting. If response rates are low, weighting can be very misleading.
Larry:
Yes. that came up in our discussion linked here: http://statmodeling.stat.columbia.edu/2016/09/23/trump-1-in-florida-or-a-quick-comment-on-that-5-groups-analyze-the-same-poll-exercise/
Here’s a number that surprised me. I downloaded the polls data from FiveThirtyEight (filtering to use just the polls only forecast), and only looked at polls with a Sept 1 end date or later. The total sample size in these polls? 3,155,370. (This includes polls done in individual states, mostly in swing states).
That’s a truly staggering number. So, while individual polls have a sampling error margin of error, the error in polling as a whole is due to nonsampling errors (adjustments and biases of various sorts).
Someone (FiveThirtyEight?) gave the quality of the various polls a grade. Here’s how those grades look (% of total sample size).
A 1.68%
A- 11.73%
A+ 1.33%
B 24.49%
B- 3.55%
B+ 2.31%
C 0.97%
C- 32.27%
C+ 6.49%
D 0.43%
(blank) 14.74%
Total 100.00%
Zbicyclist:
Yes, I thought I’d made it clear in my post that I’m talking about nonsampling error. But maybe I never actually explained that point.
The battle against nonsampling error is a bit like an arms race — methods get better, but nonresponse also increases.
Yes, I knew you were talking about nonsampling error. I was just surprised at the numbers when I added them up.
However, there is some double-counting I did not remove in my count above. For example, The following Rasmussen U.S. polls are reported separately in that database:
Start Date End Date
10/9/2016 10/11/2016
10/10/2016 10/12/2016
10/11/2016 10/13/2016
10/12/2016 10/16/2016
10/13/2016 10/17/2016
each with sample sizes of 1500. So, it seems likely that the same respondents are being reported 3 times.
As an upper middle-class Trump supporter, I recommend researchers take a close look at the possibility of Trump supporters not admittting support. Quite frankly, the toxic climate created around Trump made it impossible for many people to admit to supporting to Trump. Polls will always be off in any climate where people don’t feel comfortable admitting who they are for. Garbage in, garbage out.
JT:
As I said, I’m skeptical of this explaining much, because (a) the polls were off more in red states and in blue states, and (b) the polls were off in Senate races just as much as the presidential race, or at least that was my impression.
How many of your friends said they would vote for Hillary?
How many said they would vote for Donald?
Only one of my friends said they would vote for Trump. He is a Republican. I think some of them were embarrassed to say they would vote for Trump. I’m guessing even some who said they were voting for Clinton actually voted for Trump.
The level of villification directed toward the Republican candidate by the national media was unprecedented, even more than in 1980 when the results also came as a surprise.
Moreover, the amount of political violence in America over the last twelve months was very high by recent historical standards, with perhaps 95% of it coming from the anti-Trump half of the spectrum (and more of it coming tonight).
This isn’t my profession, so I have no technical insight to add, and I appreciate that explaining massive, systematic polling errors is a problem best left to specialists.
However, fwiw, I can say that my name came up for a polling survey one time this election season. I got a call to my personal cell phone number by a polling firm (I don’t know how they got it). I wasn’t about to admit to supporting Trump. My response got logged under HRC.
I live in a deep red state but in deep blue city/community. It’s not the case that just because someone lives in a red state they can necessarily be open about Trump support because every red state has pockets of blue.
That’s not a convincing explanation. Trump did not outperform his polls during the primaries, which is what we should expect if there is really a “shy Trump voter” effect.
In addition, shouldn’t the “shy Trump voter” effect apply most strongly in blue states? Instead, Clinton actually outperformed her polls in core blue states like California, while Trump outperformed his polls in competitive midwestern states and red states.
“But this left the question of where was the zero point.”
and it’s not just differential non-response, but also things like availability. as a west coast tech savvy person you can reach me on one of I think… 7 telephone numbers if I’m not forgetting any whereas the average 55 year old white couple in missouri?? probably not so many ways to reach them. Of course, all my telephone numbers have caller ID and various call filtering mechanisms…. the average white couple in missouri? not so much…
It seems to me like the zero point was always taken to be the time-averaged effect, whereas it seems to me like realistic poll models should have had this zero point error (aka bias) be a normally distributed constant function of time with normal(0,s) distribution and s distributed something like laplace with mean absolute deviation 2 or 3 percent. Of course since we had absolutely no data on this effect, we’d arrive at posterior distributions about 5 or 6 percentage points wider than they were, and the final realistic intervals would be something like “clinton will get between 45 and 65 percent of the 2 party vote” which your aunt sally could have told you by licking her finger.
Realistically, pollers were trying to measure the width of your finger with a stick marked in 10cm increments but they were acting as if it were 1cm increments and they could sort of interpolate at the 3 mm resolution with corrections.
sorry s distributed like exponential(1.0/2.0) percentage points, s is a positive number.
anyway, when the state space poll aggregator post came out, I tried to modify it using a smooth gaussian process and failed due to the high computational cost of the matrix calculations. Then, I tried to do some kind of basis expansion, but had too many other things competing for my time. The one thing I did do though is add an overall bias term. it just seemed obvious that such a thing could exist, and could be several percentage points. I’m shocked that the Bayesian “pros” didn’t have an unknown constant bias built into their models given 10% response rates.
Daniel, I love you. You nailed it. THIS is “political science” … when we actually try to be objective & use things like “normally distributed constant function of time with normal(0,s) distribution and s distributed something like laplace with mean absolute deviation 2 or 3 percent”, we end up with something so broad that “your aunt sally could have told you by licking her finger.”
I wonder if the “zero point” or baseline were the points where Clinton was harshly scrutinized and the election narrowed, as that tended to approximate the popular vote outcome.
Nadia:
Yes, I wonder that too, especially given that Florida +1 result that we got using MRP on party registration. That said, some pollsters such as Yougov were trying to adjust on party ID and they overestimated Clinton’s vote share too.
Polling isn’t much use if it doesn’t estimate turnout well. That underestimation is the serious issue and I don’t think you should undersell that by talking as much about the next measure in that line, meaning how the extra turnout broke.
Other issue with what you note: the 3rd party numbers might not have been materially affected by anything other than more votes for the main parties and thus of course mostly for Trump.
BTW, my reaction to being asked “when did you make up my mind?” leads me to say this part of the data is too subjective to be useful. You can’t test it. I make up my mind consciously only a day or so or week or so up to the moment I take the pen and yet I’ve been ready to make that decision all along. I’m saying the question doesn’t accurately address – in any form I’ve seen – the reality that you actually only decide when you actually vote so all the cogitation beforehand may or may not resolve to a hard choice but it’s definitely read to choose. If you moved voting day up randomly, I’d still make my decision and say I just came up with that decision recently and yet I was mentally on that road. With some people – how many? – you can go far back enough in time to identify perhaps where they actually couldn’t decide but that’s not what they do when they ask this question in an exit poll. So I’d take the 7% difference and say well that’s nice but it’s crap data.
Jonathan:
Yes, in general I don’t trust those “when did you make up my mind?” responses, but this was the only data I could find that directly addressed the hypothesis of last-minute switching.
I agree that the race was so close and small changes could and did change the final outcome. But, shouldn’t this have been reflected in computing the probabilities of success for each candidate? I mean when there’s a significant probability that everything can change, why Hillary’s success probability calculated by several polling institutions was so high (like 80%)? I think we should have been looking at something in the 50s not 80s.
Mahdi:
No, I think you’re wrong on this. Just as a simple example, if you take a random draw from a normal distribution with mean 1 and sd 1, there’s an 84% chance that your observation will be positive. But 1 s.e. errors happen all the time! The real issue is that 80% is not as high a probability as you might think! I could see good arguments for putting the probability in the 60s (as Nate Silver did), but the 50s, I don’t think so. Unless your model is explicitly accounting for factors such as enthusiasm of Trump supporters. I can’t see how a pure poll-averaging approach could get you down into the 50s.
My initial reaction was also along Mahdi’s line. But I’m also having some issues with the probability language. That goes for the extreme predictions, but also the ones that I have read here.
Are we technically correct in reporting posterior distributions as a probability? And related, does this probability adequately communicate the fact that these small (never mind, 2 % is not so small in an election!) errors translate in huge shifts in the posterior distributions?
One of the ways to deal with this is to let use this uncertainty to dial down our probability estimates. Another possibility is to come up with a vocabulary around that transformation.
Not to blame the analysts here – I think this latter point was emphasized in many articles.
> Are we technically correct in reporting posterior distributions as a probability?
If the prior and data model are true, it literally is a probability.
More purposefully, if the prior and data model adequately represent the reality you are trying to get at (you’ll never know this) then literally taking it as a probability will lead to actions that are not frustrated by reality (does not mean you will _always_ succeed but rather at the probability assessed.)
Here is a nice example of an 84% probability based on almost no data – http://statmodeling.stat.columbia.edu/2016/08/22/bayesian-inference-completely-solves-the-multiple-comparisons-problem/
Now, almost of the information is coming from the prior and data model and with a single sample its impossible to assess/test the data model or the prior (which can be much better assessed with repeated replications).
So it is all almost complete blind faith in the model – the 84% probability.
Mike Evans has done interesting work on formally addressing these issues that have yet to be fully vetted and criticized (short article https://www.ncbi.nlm.nih.gov/pmc/articles/PMC4726790/ and more http://utstat.utoronto.ca/mikevans/papers.html
More unfortunately here, there is non-sampling error which means the prior and data model are frighteningly wrong to an unknown degree (though there may be sensible priors about how wrong in which ways.)
In communicating the Kremp poll to my wife I said it was a good sign but then when I passed on the revision by Andrew with the early results, I indicated far less uncertainty than I should have (even though I was worried about the almost no time for model checking).
“Final polls had Johnson at 5% of the vote. He actually got 3%, and it’s a reasonable guess that most of this 2% went to Trump.”
Why is that a reasonable guess? I hope you’re not assuming that libertarians are a subset of conservatives.
Anon:
Johnson is a former Republican and he stated strong opposition to Clinton so it seems reasonable to suppose that Johnson supporters did not split 50/50 between Clinton and Trump but rather that more of them went to Trump.
The Libertarian ticket of Johnson and Weld was very strong, having won 4 gubernatorial elections as Republicans between them. William Weld is kind of the William Hurt of GOP politicians, a former superstar, so having him as the VP candidate made the Libertarian ticket particularly attractive to upper middle class Republicans dismayed by Trump’s prole taste than in the past when the Libertarian VP nominee was usually a pretty marginal figure.
So my guess is that most of the Libertarian vote came from people who normally vote Republican but couldn’t take Trump. Almost all of Jill Stein’s vote came from people who, if forced to choose, would have voted for Hillary.
So, I’d guess that for analytical purposes we could probably discard the third party vote and just look at the two party vote.
Moreover, Trump was running a cheapskate campaign, so he didn’t try to notch better national vote totals by appealing to California, Texas, or New York. In the battleground states where he concentrated his effort, he did strikingly well.
I ASSUME that Johnson was a popular pick among the citizens who wanted to tell the pollsters to shove it.
As long as you weren’t one of the 99+ win probability guys (looking at you Sam Wang) I don’t know the basis on which anybody could claim anything other than mild surprise at this result. Take the modal HRC win probability at 85%. That would make Trump 5-1 or 6-1 to win. Don’t 15% probability events happen, oh, just to pull a frequentist estimate out of my ass, 15% of the time? All you need is a 3 percent margin of error and some reasonably high regional correlations among the results and you’re done. As I understand it, Nate Silver was one of the few to create not just pairwise correlations, but separate regional correlations as well, so that in the 15% of scenarios where the Great Lakes skews Trump (throwing in PA) she’s toast. To me, the only way one could be shocked by the result is to have no sense of what the phrase “85%” means. A baseball team up two runs in the eight inning (sorry, Shravan) has about an 85 percent chance of winning. But lots of them lose every single season.
After the Cubs were down 3-1 in the series, 538 put their odds of winning at 15% (not far from a p=.5 binomial at 12.5%).
Sure, there was suprise that the Cubs pulled it out, but not shock.
Zbicyclist:
I was thinking about this recently, maybe it’s worth another post. The short version is that people are reacting not just to the conditional probability, Pr (Trump wins | Trump reaches Election Day with 48% of two-party support in the polls), but to the unconditional probability, Pr (Trump becomes president of the United States | our state of knowledge two years ago). That unconditional probability is very low. And I think a lot of the stunned reaction is in part that things got so far.
To use a poker analogy: if you’re drawing to an
insightinside straight on the river, the odds are (typically) against you. But the real question is how you got to the final table of the WSOP in the first place.I like the “insight [sic] straight” ! (Now if we can just get some insides into this problem …)
But the Cubs, based on regular season performance, were a better team than the Indians so that they came back to win the World Series was not all that surprising.
The question is whether Trump and his issues (e.g., borders) are a better combination than Hillary and her issues (e.g., Alicia Machado’s feelings).
We have a sample size of one, so it’s hard to tell for sure. But …
Yes, the Cubs issue is misunderstood if you compare blunt counting of 3-1 teams without assigning priors. If you look at every Series team – skip the rounds before for simplicity at first and then multi-level it – you assign weights which can be rough at first, to each team’s quality and then you find how many better clubs lost 4-0 and 4-1 and 4-2 and 4-3 and you can then isolate further. I’m surprised when I read people talk about odds without acknowledging priors about the teams.
Jonathan:
I agree with you on the 15% thing. At the same time, when these 15%-events occur, it’s good to try to understand them. After all, the “margin of error” from which this 15% is coming is nonsampling error, so in some sense it does mean that something went wrong. It may not have been avoidable a priori, but once it’s happened it makes sense to open up the “black box,” as it were, and see if the particular error could be avoided the next time.
I’m more concerned that they got the geometry wrong. That is, when they scale the abstractions of the raw vote: n guesstimates (and then add error by converting into circles/spheres/etc.), that they systematically removed the inherent error in scaling according to an internal bias, meaning their priors affected the them at the determination of n level and they couldn’t notice that. Nor could any aggregator or interpreter of polls because it’s just like when you get an investment calculation and you have no idea which little input assumptions are in there, let alone their bossing effect. I think one problem is the need for certainty in this work at the n level, by which I mean they want to reduce freedom of n as much as possible, even though that introduces bias effects which can become completely opaque until they reveal themselves. I can’t imagine pollsters saying “well, it could be this huge range because turnout numbers are so variable” and yet that determination of n is typically what really matters and if they get that right then the polls are generally right too. So my concern from above is “how did their priors influence scaling and conversion?” A 5% difference is a huge number – 6+ million – but that spread across the country, even a relatively small part if populous enough, devolves into fairly small numbers that can be affected by scaling and conversion. I reference, btw, the Detroit Free Press story about their wrong election night projection of their own state: their guy, who has a long history of accuracy, checked 80 precincts. Their mea culpa really asks: how did they miss turnout in other precincts despite the history of sampling? Is this an out-of-box error? I’d say they can respond for the future by increasing sampling, meaning try to fix any actual data collection issues, but they also need to ask themselves about how they scaled and converted that data into actual expected n. I’d say this is an example of how models work until they don’t and then something comes along which reveals a weakness and that weakness is typically a bias buried in the most basic levels of data collection and basic scaling/conversion. I mean literally that 80 precincts works typically but that in this more complex “model” the 80 precincts did not capture enough information that scaling worked properly. If they revise from both ends, then they can fix this, at least for a while.
I agree about wanting to know sources of what went wrong. I meant to say I think more valuable are answer to surveys in which people say “I’ve made up my mind” versus people who say “I haven’t made up my mind” and that post-event surveys are a less reliable indicator so I’d put more value in the trend than in some undiscovered or unrecognized late breaking curve ball. I’d probably stick to this position until I see more value in the post-hoc perspective.
“I don’t know the basis on which anybody could claim anything other than mild surprise at this result.”
The basis is obvious. It is a bunch of people living a bubble, who have spent zero time in any red US county unless it had a beach or a ski area or a national park.
I think we have to seriously rethink why polling and polling aggregators/forecasters went so bonkers this year. We can no longer imagine that our presidential election isn’t purely a media circus (on ALL sides), and exists largely to support its own enterprise rather than inform voters and select a leader for the free world. My first guess here is that all the 538/Upshot/PredictWise/etc stuff is purely commercial in nature, whether intended to be so or not. We’ve got a few years to think about this, and I think its worth it.
Also, any idea on where to get detailed election results? Like, county or district level?
Thanks for your always great work,
Hmmm… “select a leader for the free world”. Actually, I thought that the election was just for President of the USA. If it was for world president, I must have forgotten to vote. We in the free world (whatever that really is) don’t actually find “leader of the free world”, “greatest country on earth” and other xenophobic polemics that useful, well unless “greatest” refers to consumption of resources.
+1
I think it’s clear that we don’t understand what effects are correlated (e.g. biases that will occur across all states, such as Trump voters being why) and which effects are closer to random.
This isn’t just polling. Recall Salmon’s famous article on “The Formula That Killed Wall Street”, which basically reflected an understanding of correlation that was faulty.
I’ve written some longer thoughts here: http://www.truncatedthoughts.com/2016/11/what-went-wrong-with-presidential.html
+2
I’m a lurker on this site and rarely chime in, but I’ll do so now–not in a statistical way, but with some anecdotal evidence that supports some of the above points. I’m from Pennsylvania, and live in the rural central part of the state, which Jim Carvill famously called the ‘Alabama’ part of Pennsylvania. PA was supposed to go to Clinton rather comfortably, but obviously didn’t. In this part of PA the Trump signs outnumbered the Clinton signs about 50 to 1. When I went to vote yesterday I was roughly the 300th person to vote at my polling place. I always vote at the same time of the day. Every other year for the past 30 I was number 150-200. The elderly ladies who were conducting the election repeatedly commented that they had never seen this turnout before, and they’d been doing the elections for decades. One of my wife’s friends is also an election worker, and she said that people came out to vote whom she had never seen voting in 20 years. Given the demographics here, these voters were overwhelmingly Trump supporters.
Andrew notes above that Trump did better than expected in red states. Judging from this purely anecdotal evidence, Trump also did better than expected in the Red parts of otherwise Blue states like Pennsylvania, which helped him to carry at least this state. In some counties in this area of PA, Trump received almost 5,000 more votes than Romney did in 2012. That may not sound like much, but Trumps margin over Clinton in PA was only about 70,000 votes. I suppose that you could argue that some Obama voters in these counties in 2012 switched to Trump this time, but given the demographics here, realistically that didn’t happen.
Interestingly, there were three state-level races in Pennsylvania–treasurer, auditor and attorney general. Democratic candidates won all three. Two of these winning candidates received more votes for their offices than Trump did for President!
“Andrew notes above that Trump did better than expected in red states. Judging from this purely anecdotal evidence, Trump also did better than expected in the Red parts of otherwise Blue states like Pennsylvania”
Yup, that was basically the strategy: get more turnout from the kind of white people who found Mitt Romney a cold fish. Here’s my November 12, 2012 article pointing out that Romney narrowly lost 80 Electoral Votes in six states running from Pennsylvania to Iowa because he failed to run up a big margin among white people. Romney especially failed to appeal to white working class men:
http://www.vdare.com/articles/slippery-six-mid-west-states-doom-romney-because-of-low-white-share
Turnout in Pennsylvania this week (taking into account votes for the two main candidates) was just 1.5% higher than in 2012, which is probably below the population growth during the 4 years in between. So, no, turnout was not higer.
Annual Census estimates put Pennsylvania’s population growth between 2012 and 2015 at 0.2%. (See https://goo.gl/KBhyOj.) This does suggest that Pennsylvania turnout really was higher this year than in 2012. And — I think this is more to the point — turnout could have increased in rural Pennsylvania even as it remained stagnant or declined in the cities.
Following up: it’s hard to compare the 2012 and 2016 turnout rates in Pennsylvania, because slightly different kinds of data are available from each year. (See Michael McDonald’s http://www.electproject.org/home/voter-turnout/voter-turnout-data for details.) But Pennsylavania’s Department of State makes clear that about 6.5% more ballots were cast in the 2016 presidential election than in the 2012 presidential election. If we restrict our attention to just the top two candidates in each year, about 4.0% more ballots were cast.
Again, this increase in ballots cast occurred even though the Census estimates only 0.2% population growth in Pennsylvania between 2012 and 2015. So the apparent growth in Pennsylvania turnout doesn’t just seem real. It seems large.
Pennsylvania’s Department of State also shows that the growth in ballots cast in Philadelphia County and in Allegheny County (Pittsburgh) was much lower than the statewide growth, whether or not one restricts the analysis to the top two candidates. So turnout growth in the suburbs and in rural areas may have been even greater than in the state as a whole.
In my opinion, there are two types of errors in polling. One is the statistical sampling error, which can be modelled and controlled. But the other and less controllable error is a systematic bias in the answers of the respondents. The most dominant effect for systematic bias is usually the social desirability effect, i.e. respondents tend to say what they think they should say, and not what the think is the truth. In my everyday experience as a market and social research professional I have seen numerous studies showing this effect. You can see it almost everywhere where people are asked about their behaviour. If you ask people about their smoking behaviour, you get a huge error in their answers, because people simply won’t admit that they do. In that case they are more or less lying. But if you ask people about their future behaviour and get this bias in the answers, they aren’t exactly lying. It is seemingly very difficult for people to predict theit own behaviour. When asked, people are quickly inventing all kinds of answers which makes them more social compatible than they really are. Many, many studies about purchase intention show this effect, and there are large cultural and social differences between people. Some cultures are more ‘rational’ and in some others it is simply impolite not to tilt the answer in the direction of the presumed social desirable answer.
But as it has been noted, that would suggest that Trump support should have been larger than it was predicted in the blue states, where the “social desirability” of voting for Clinton would have been higher. But the polls were mostly correct in the blue states. just think about NYC. If the social desirability thesis was right, shouldn’t Manhatten have gone for Trump in much larger numbers (more along the lines of Staten Island)? Or think about Michigan in the primaries, where Sanders won against expectations. Do you want to apply the same “social desirability” thesis there as well?
I wonder if the problem was more that a lot of Trump supporters so mistrust the establishment they just simply stopped responding to pollsters, rather than lie to them. I would grant that maybe some people who said they were undecided were just not saying they were going to vote for Trump, but the ones I heard were otherwise not shy about expressing policy views that certainly were more aligned with Trump than Clinton.
Or maybe we really need county-by-county polling rather than state polling, or, given how horribly expensive that would be, do Mr P according to county rather than party identification.
I heard a lot of people saying things like they held their nose and voted for the least worst candidate; or that they voted for the least worst candidate and prayed (or prayed, then voted, then prayed again). I suspect that people with these attitudes were quite likely to delay making a decision (not just which candidate to support, but maybe whether to vote at all).
But also, caution is needed when proclaiming what other people’s thinking is — e.g., what is “socially desirable” to someone else, particularly if they are from a different background than you. And basing an opinion on whether someone is from a red or blue state is unwise, since red states have pockets of blue prevailing opinion, and vice-versa.
Another factor is that the “standard categories” (e.g., red and blue) don’t always fit. I try to keep in mind the time when my mother voted democratic for president but republican for governor, and my father voted exactly the opposite.
That’s kind of my point. I don’t really believe there is much evidence to support the idea that people lied to pollsters because they were saying what they thought they “should” say rather than what they actually believed. I think if that were true, we would have seen more Trump support in, say, Manhattan, rather than see such a large difference between Manhattan and Staten Island. Polls seemed to have over-estimated Clinton’s support in Michigan, first in the primary (which didn’t see Sanders winning), then in Wisconsin (which didn’t see Trump winning).
My point about post-stratification along county rather than political party within state polls is also pretty much consist with what what you man by “pockets” of red in blue and vice versa. I haven’t actually looked at the data or models closely enough yet, but my suggestion is that when we make non-response adjustments, maybe county should be one of the variables in the demographics. Again, I suspect that it is the non-response adjustments that are the reasons why the polls were off, not that people were lying to pollsters, but that’s just an opinion at this stage.
I’d say that the critical distinction here is what “should say” means. Does it mean “should” as in “what my neighbors and coworkers say — what is expected of me”, or as in “is this person representative of what I believe — are they a good person/president”?
In the first sense, I’d expect to see hidden Trump voters in Blue areas. It’s unpopular — perhaps even dangerous to friendships or careers — to express your views so you keep them to yourself.
In the second sense, I’d expect to see hidden Trump voters in Red areas because more people in those areas openly express Trump support, but that doesn’t mean that you are comfortable with the choice.
This could be a Forking Paths meander of course. But I do think it makes a lot of difference whether your discomfort is internal or external. That discomfort could play out differently: actually lying to a pollster and saying you’re voting for Hillary, lying to a pollster and saying you’re not going to vote or you’ll vote third-party, or simply refusing to talk to a pollster.
There’s also the push-polling issue which I ran into this year as well. I generally don’t waste my time on phone polls, but decided that I work with data, so I should try being cooperative with a pollster. For about 5-10 minutes, it felt like a real poll and the guy was friendly. Then it got down to particular candidates and suddenly the guy got antsy and when I suggested one, I got a “Really? Well have you heard about scandal X and scandal Y and…” before I cut him off. I don’t know if it was just an over-enthusiastic poll person or a push-poll, but I have returned to my policy of not answering polls. Depending on whether one side or the other was using that tactic more and in what states they felt were in play, that could also sway people into not dealing with polls.
I was at a dinner party in one of the more conservative parts of Southern California awhile ago, the San Gabriel Valley suburb of Sierra Madre. One guest went on a long rant about how Trump appealed to stupid people, unlike us here at the table. Another guest tossed in witty asides that the anti-Trump ranter took as support, but when carefully analyzed clearly revealed a subversive pro-Trump stance. Then I went to another dinner party the next week in liberal Sherman Oaks where the exact same thing happened: a long politically correct rant subtly subverted by another guest’s witty and ambiguous wisecracks.
My guess is that Donald Trump is President-Elect because enough witty people in the suburbs of Detroit, Milwaukee, Philadelphia, Cleveland, and Miami held their tongues until they got into the privacy of the voting booth.
Does this make voting for this man any smarter? Or is any decision wise if enough people do it?
As far as I understand Steve thinks that one of the (or both) statements are false:
1)people who voted for Obama in 2008 and 2012 are on average any smarter than people who voted for Trump in 2016
2) Obama won in 2008 due to the people who are on average smarter than the people due to whom Trump won in 2016
(the second one is supposed to say something about the “crucial causal element” , something like “key state” etc. rather than simply the “party average” )
What data shows that Steve is wrong?
I really don’t get this comment . Sure, if two out of a hundred people had voted differently, the election would have gone the other way (and we would telling stories about the wife who said witty comments while her husband said “Trump that bitch). But the question is what caused the polls to be off. No one suggested Clinton would get 100% of the suburban vote. I haven’t seen any data, but are you suggesting the polls were off because they underestimated Trump’s support in areas that traditionally lean Republican?
When this sort of bias is a real concern (for instance, if you ask athletes whether they’ve ever used banned performance enhancing drugs), some surveys resort to adding noise to the answers in a way that allows individual respondents to hide their true answer in the noise.
Something like: Who would you vote for right now? Roll a die. If it’s 1 or 2, state Trump, if it’s 5-6, state Clinton. Otherwise, please give your actual opinion
This way, you add variance to reduce bias.. if this actually does encourage more truthful answers.
Anon:
I’ve always been suspicious of randomized response and list experiments and implicit bias tests and other methods that are designed to trick people into giving accurate responses. See for example here.
After two Bush presidents and two Trudeau prime ministers, you start getting people on that continent showing up to vote against that type of thing. That is the elephant in the room no one wants to talk about.
Trump didn’t talk about it, though. He probably wants one of his kids to be President, too.
To the point that blue states and red behave differently: you are right that the social desirability effect does not explain this without any additional assumptions. But I think if you assume that people in the red states have lower education, lower occupation rates and less income, which probably is the case, and they feel somehow forgotten by society, you have all the ingredients together to explain the red to blue state difference. As Bill Clinton said: when people feel they’ve been shafted and they don’t expect anything to happen anyway, they just want the maddest person in the room to represent them.
I think that is a direct repetition of the circumstances that led to the Brexit vote in UK. In that referendum, many people justed wanted to express their discontent with their situation and their vote for Brexit had nothing to do with the referendum itself. It seems that many of the people who voted for Brexit had no idea what they voted for.
If you look at Google trends, you will find that “who is trump” peaked directly AFTER the election day. It was the same in the UK, where “what is Brexit” peaked after the election as well.
I know that this is not a proof, but it makes the observed results and forecasting errors in my view at least more plausible.
Higher income generally means more Republican. According to exit polls, Trump won all the income groups over 50k and lost the two sub 50k groups. It’s true red states generally have lower average income than blue states but the aggregation is a little misleading.
One of the most interesting things about presidential elections, in my view, is the deftness with which the campaigns are able to split the US population exactly down the middle. This is of course because they constantly change their positions, guided by continuous polling over a (very) long period and unconstrained by any thought of how realistic their promises are. It is also because negative campaigning is used as much as it is.
It’s as if elections are set up to play one half of the population off against the other as fruitlessly as possible. Today it’s basically unthinkable that someone might come along and, through their rhetoric and policies, bring, say, 80% of the country together on a program for the next four years. That’s sad since there are in fact a number of simple things that could be done which really would improve the lives of 80% of the population if they’d just set aside their bigotries (as much on the Left as the Right.)
You might be ascribing too much credit to the campaigns as opposed to the populations. Voters also tend to vote to punish the incumbent party during midterms, as if some kind of balancing process is going on. We just saw Trump grab a larger than usual share of the white vote when the Democrats were expecting demographic changes to assure their victory, and the two are likely to be related.
The problem with my theory and the more common median-voter theory is that there are countries (Japan, Mexico, possibly Canada) where a “natural governing party” seems to win a large majority of the time.
I think you just informally derived the median voter theorem.
We saw an interesting example of it in action a few years ago when a big chunk of the opposition in Israel decided to align itself with PM Netanyahu, giving him a huge majority (70% of Knesset seats, iirc). After a few months, however, Netanyahu kicked the newcomer parties out of his coalition because he’d rather have a smaller majority to distribute pork too.
I think he just interpreted the world in terms of an informal median voter theorem.
But your comment was funnier, so probably wins in terms of internet.
I think Wonks is right that my comment intended to attribute the truth (if that is what it is) of the median voter theorem to democratic processes, not populations. I like to think (but should perhaps think more about it) that I could design a process that would not inevitably produce a result that is endorsed by half the population and opposed by the other. One way would be to forbid polling. Another, I think, would be to replace elections with a system by which citizens could continuously withdraw their support for a representative or a policy. Another would be to shorten or do away with campaigning altogether (I honestly don’t know why populations put up with that noise). I don’t think a system, such as the current one, that spends a year and a half setting up what is essentially a coin toss is the best imaginable one.
I’m gonna win in terms of internet so much I may even get tired of winning; I’ll be so tired of winning I can’t take it anymore, but I’ll have to keep winning, and keep winning more and more.
Dear Andrew
Could you comment on one of the “conspiracy theories” in the conservative media and spread by Trump himself, that some polls were _deliberately_ skewed (through methodological or analytic choices) to boost Clinton’s support. The aim of this, purportedly, would be to suppress enthusiasm for Trump by downplaying his chances. Is your Florida poll anecdote supportive of that, and how would analysis of other polls be able to support or disprove this theory?
Regards
Bob
Bob:
I doubt it. What our analysis of the Florida poll showed is that the result you get will depend on what population to adjust to. When pollsters don’t adjust in some way for partisanship, their poll numbers will jump around. I see no reason to think that pollsters were trying to get the wrong number on purpose; rather, I think that (a) some pollsters are tied to using old-fashioned methods that don’t adjust for partisanship, and (b) the combination of differential nonresponse and differential turnout in 2016 was particularly harmful for conventional polling. The incentives for pollsters are all for them to get the final number accurately. Also, beyond this, I see no evidence and no reason to believe that reporting Clinton at 52% of the two-party vote rather than 50% would give her any benefit on election day.
Maybe Trump’s rallies were a significant factor. Trump spoke to an enormous number of people in key states. Maybe the people who saw him in person felt a personal bond and a personal duty to vote for him. And maybe some of that enthusiasm spilled over to their friends.
Maybe TV ads have lost their effectiveness: shallow, repetitive, grating, and repellent to many people. Also, of course, many people are not reachable by TV ads. If you have ever watched a Trump rally, you know that they were particularly effective and they generated genuine enthusiasm, and they gave supporters the feeling they weren’t alone, indeed, that there were many other people enthusiastic for Trump.
Does anyone know where I can have access to data from 2012 and 2016 to replicate the charts Andrew presented?
I´d like also to compare low-income votes on Obama and Hillary (probably using exit-polls). I´ve seen people saying Hillary performed worse than Obama among low-income voters, but couldn´t find a source for that.
Sorry if the source for such data is obvious. I´m a Brazilian and don´t know where to start.
I appreciate for any point in the right direction.
“One more thing: I think one reason for the shock is that people are reacting not just to the conditional probability, Pr (Trump wins | Trump reaches Election Day with 48% of two-party support in the polls), but to the unconditional probability, Pr (Trump becomes president of the United States | our state of knowledge two years ago). That unconditional probability is very low. And I think a lot of the stunned reaction is in part that things got so far.”
Otherwise known as confirmation bias.
One accusation not mentioned is your own bias. This issue is central to the Trump camp belief that pollsters were consciously manipulating their results. Great writeup and believe me when I say that I don’t mean any disrespect. I am a student learning statistics and wonder if this was at all at play.
Thanks,
Ben
Ben:
I really really doubt that pollsters were consciously manipulating their results. I think they made a mistake by assuming voter turnout in 2016 would be similar to that in 2008 and 2012.
Was there a bias? Maybe so. It would be an indirect bias. Not a manipulation but that the poll results were showing what many people were expecting (a Clinton lead) and so pollsters didn’t do a good enough job of questioning their assumptions.
Again, pollsters had nothing to gain and everything to lose by getting their predictions wrong. Their problem was not that they were trying to manipulate the polls. Rather, their problem was that their ordinary, unmanipulated numbers were in error and they did not question these numbers. The problem, in my view, was not “manipulation” (let alone “conscious manipulation”) but rather that the numbers were not sufficiently adjusted to account for changing conditions—in this case, Obama not being on the ballot this time.
Saw an interview this morning with one of Trump’s chief pollsters. His group, Cambridge Analytica, had Trump at 30% going into Tuesday, insignificantly different than Nate Silver.
He also said that literally every poll was generating the same raw numbers, and that post-stratification was the entire game.
Perhaps it was not manipulation but fear of manipulation which explains the differential non-response. Trump’s campaign kept repeating that the mean stream media and pollsters were not to be trusted. Core Trump supporters receiving a phone calls from organizations they distrusts would be less likely to respond just because of this distrust.
That does not directly answer the question why core supporters in Romney states were more affected by this. Perhaps it was easier for them to be fully immersed in the Trump bubble?
I think many of the modelers fell into the trap of believing their model way to much. We will never know what the true odds were, but I am pretty subjectively confident that anything over 90% was wrong and anything over 80% is questionable. A simple look at the RCP polling averages would have told you that.
I give Nate Silver a lot of credit for subjecting his model to high level heuristics like “How much has the election result been different from the polls in the past?” and what would happen if all the state polls moved in that direction. A simple analysis like that one would have given you odds somewhere in the 3-1 to 4-1 range.
Also anyone who is running any analysis like this should be checking the prediction markets, if they are at 75-80% as they were in the week leading up to the election and your model is at 90%+, you probably ought to be subjecting your model to a ton of scrutiny.
In Finland, the polls could not show the huge increase in the share of individuals voting for conservative populistic party in government election few years ago. Also the polls underestimated the probability of brexit in Britain.
I argue that the issue is cross-national and related to protest votes, voters that have not previously voted and individuals not answering to the polls that they would vote for the populistic party. In any case, similar surprises have occurred during recent years in other countries and the reasons are not likely to be country- or candidate-specific. The common issues are related to protesting political elite, anti-migration attitudes, arguments against globalization etc.
“protest votes”
I love this term. Is it a “protest” to vote against a deeply-troubled candidate who runs a campaign of terror & hate against her adversaries? Bubble much?
“similar surprises have occurred during recent years in other countries … related to protesting political elite, anti-migration attitudes, arguments against globalization”
You’re lost in the actual CAUSE of why the Polls get it wrong rather than why the good-guys win. The CAUSE is that a notable % of the people being polled KNOW that the pollsters are aligned with one side (the wrong side) & they refuse to participate. Some may not answer. Some may lie. In any event, a notable % of people know the pollsters are their enemy, not their friend. That is a GREAT basis for a conversation. HA!
In 2012 BO got 65 million and MR got 60. Right now, they are both at 60.5 and 60 million. I can’t imagine 5 million votes will come in. Is that possible? That said, I believe eligible voters must be down.
> … given that Trump outperformed the polls the most in states such as North Dakota and West Virginia where I assume respondents would’ve had little embarrassment in declaring their support for him…
The Tom Bradley effect – https://en.wikipedia.org/wiki/Bradley_effect
Richard Rorty in 1998:
“Members of labor unions, and unorganized unskilled workers, will sooner or later realize that their government is not even trying to prevent wages from sinking or to prevent jobs from being exported. Around the same time, they will realize that suburban white-collar workers — themselves desperately afraid of being downsized — are not going to let themselves be taxed to provide social benefits for anyone else. At that point, something will crack.
The nonsuburban electorate will decide that the system has failed and start looking around for a strongman to vote for — someone willing to assure them that, once he is elected, the smug bureaucrats, tricky lawyers, overpaid bond salesmen, and postmodernist professors will no longer be calling the shots… One thing that is very likely to happen is that the gains made in the past forty years by black and brown Americans, and by homosexuals, will be wiped out. Jocular contempt for women will come back into fashion… All the resentment which badly educated Americans feel about having their manners dictated to them by college graduates will find an outlet.”
Ref – https://www.jacobinmag.com/2016/11/donald-trump-election-polls-whites-working-class/
Wow.
I’ll be organizing a seance with the hope that Rorty will give me next week’s Powerball numbers too. Anyone else want in?
Another cause of polling error being cited by some of the aggregators is herding by pollsters – where pollsters give extra scrutiny to results that deviate significantly from other pollsters.
A question: Do the pollsters take into account the the electoral college math? That is, are the pollsters predicting the popular vote or the electoral vote?
Bercedis:
There are national polls and state polls, and the best analysts use both, and, yes, they take into account the electoral college. See Pierre-Antoine Kremp’s page for an open-source example.
“I’m skeptical of this mattering too much, given that Trump outperformed the polls the most in states such as North Dakota and West Virginia where I assume respondents would’ve had little embarrassment”
Incredible. Did you really dismiss a theory based on YOUR ASSUMPTION?
ps: It is an ASSUMPTION that I can easily reverse with equally valid points. (> equally valid, I ASSUME)