We’re always discussing election results on three levels: their direct political consequences, their implications for future politics, and what we can infer about public opinion.
In 2018 the Democrats broadened their geographic base, as we can see in this graph from Yair Ghitza:

Party balancing
At the national level, what happened is what we expected to happen two weeks ago, two months ago, and two years ago: the Democrats bounced back. Their average district vote for the House of Representatives increased by enough to give them clear control of the chamber, even in the face of difficulties of geography and partisan districting.
This was party balancing, which we talked about a few months ago: At the time of the election, the Republicans controlled the executive branch, both houses of congress, and the judiciary, so it made sense that swing voters were going to swing toward the Democrats. Ironically, one reason the Democrats did not regain the Senate in 2018 is . . . party balancing in 2016! Most people thought Hillary Clinton would win the presidency, so lots of people voted Republican for congress to balance that.
The swing in votes toward the Democrats was large (in the context of political polarization). As Nate Cohn wrote, the change in seats was impressive, given that there weren’t very many swing districts for the Democrats to aim for.
Meanwhile, as expected, the Senate remained in Republican control. Some close races went 51-49 rather than 49-51, which doesn’t tell us much about public opinion but is politically consequential.
Where did it happen?
The next question is geographic. Nationally, voters swung toward the Democrats. I was curious where this happened, so I did some googling and found this map by Josh Holder, Cath Levett, Daniel Levitt, and Peter Andringa:
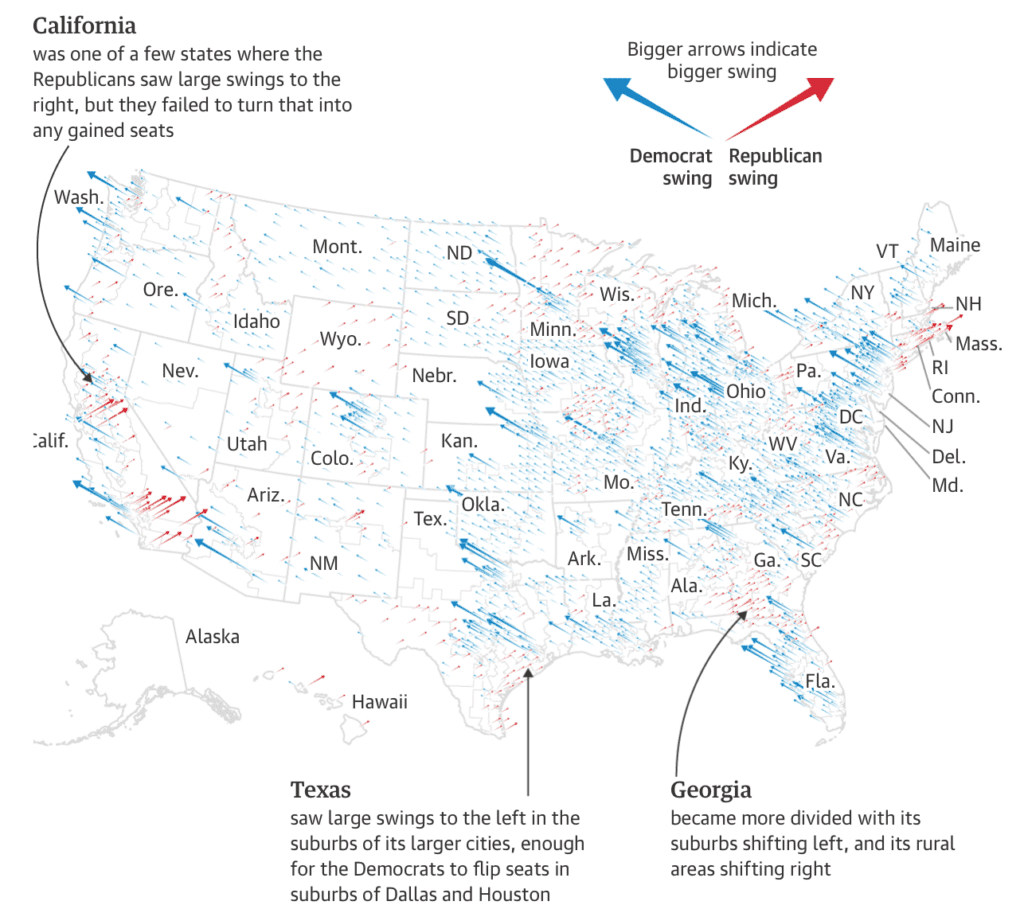
This map omits districts that were uncontested in one election or the other so I suspect it understates the swing, but it gives the general idea.
Here’s another way to look at the swings.
Yair made a graph plotting the vote swing from 2016 to 2018, for each election contested in both years, plotting vs. the Democratic share of the two-party vote in 2016.
The result was pretty stunning—so much that I put the graph at the top of this post. So please scroll up and take a look again, then scroll back down here to keep reading.
Here’s the key takeaway. The Democrats’ biggest gains were in districts where the Republicans were dominant.
In fact, if you look at the graph carefully (and you also remember that we’re excluding uncontested elections, so we’re missing part of the story), you see the following:
– In strong Republican districts (D’s receiving less than 40% of the vote in 2016), Democrats gained almost everywhere, with an average gain of, ummm, it looks something like 8 percentage points.
– In swing districts (D’s receiving 40-60% of the vote in 2016), D’s improved, but only by about 4 percentage points on average. A 4% swing in the vote is a lot, actually! It’s just not 8%.
– In districts where D’s were already dominating, the results were, on average, similar to what happened in 2016.
I don’t know how much this was a national strategy and how much it just happened, but let me point out two things:
1. For the goal of winning the election, it would have been to the Democrats’ advantage to concentrate their gains in the zone where they’d received between 40 and 55% of the vote in the previous election. Conversely, these are the places where the Republicans would’ve wanted to focus their efforts too.
2. Speaking more generally, the Democrats have had a problem, both at the congressional and presidential levels, of “wasted votes”: winning certain districts with huge majorities and losing a lot of the closer districts. Thus, part of Democratic strategy has been to broaden their geographic base. The above scatterplot suggests that the 2018 election was a step in the right direction for them in this regard.
Not just a statistical artifact
When Yair sent me that plot, I had a statistical question: Could it be “regression to the mean”? We might expect, absent any election-specific information, that the D’s would improve in districts where they’d done poorly, and they’d decline in districts where they’d done well. So maybe I’ve just been overinterpreting a pattern that tells us nothing interesting at all?
To address this possible problem, Yair made two more graphs, repeating the above scatterplot, but showing the 2014-to-2016 shift vs. the 2014 results, and the 2012-to-2014 shift vs. the 2012 results. Here’s what he found:
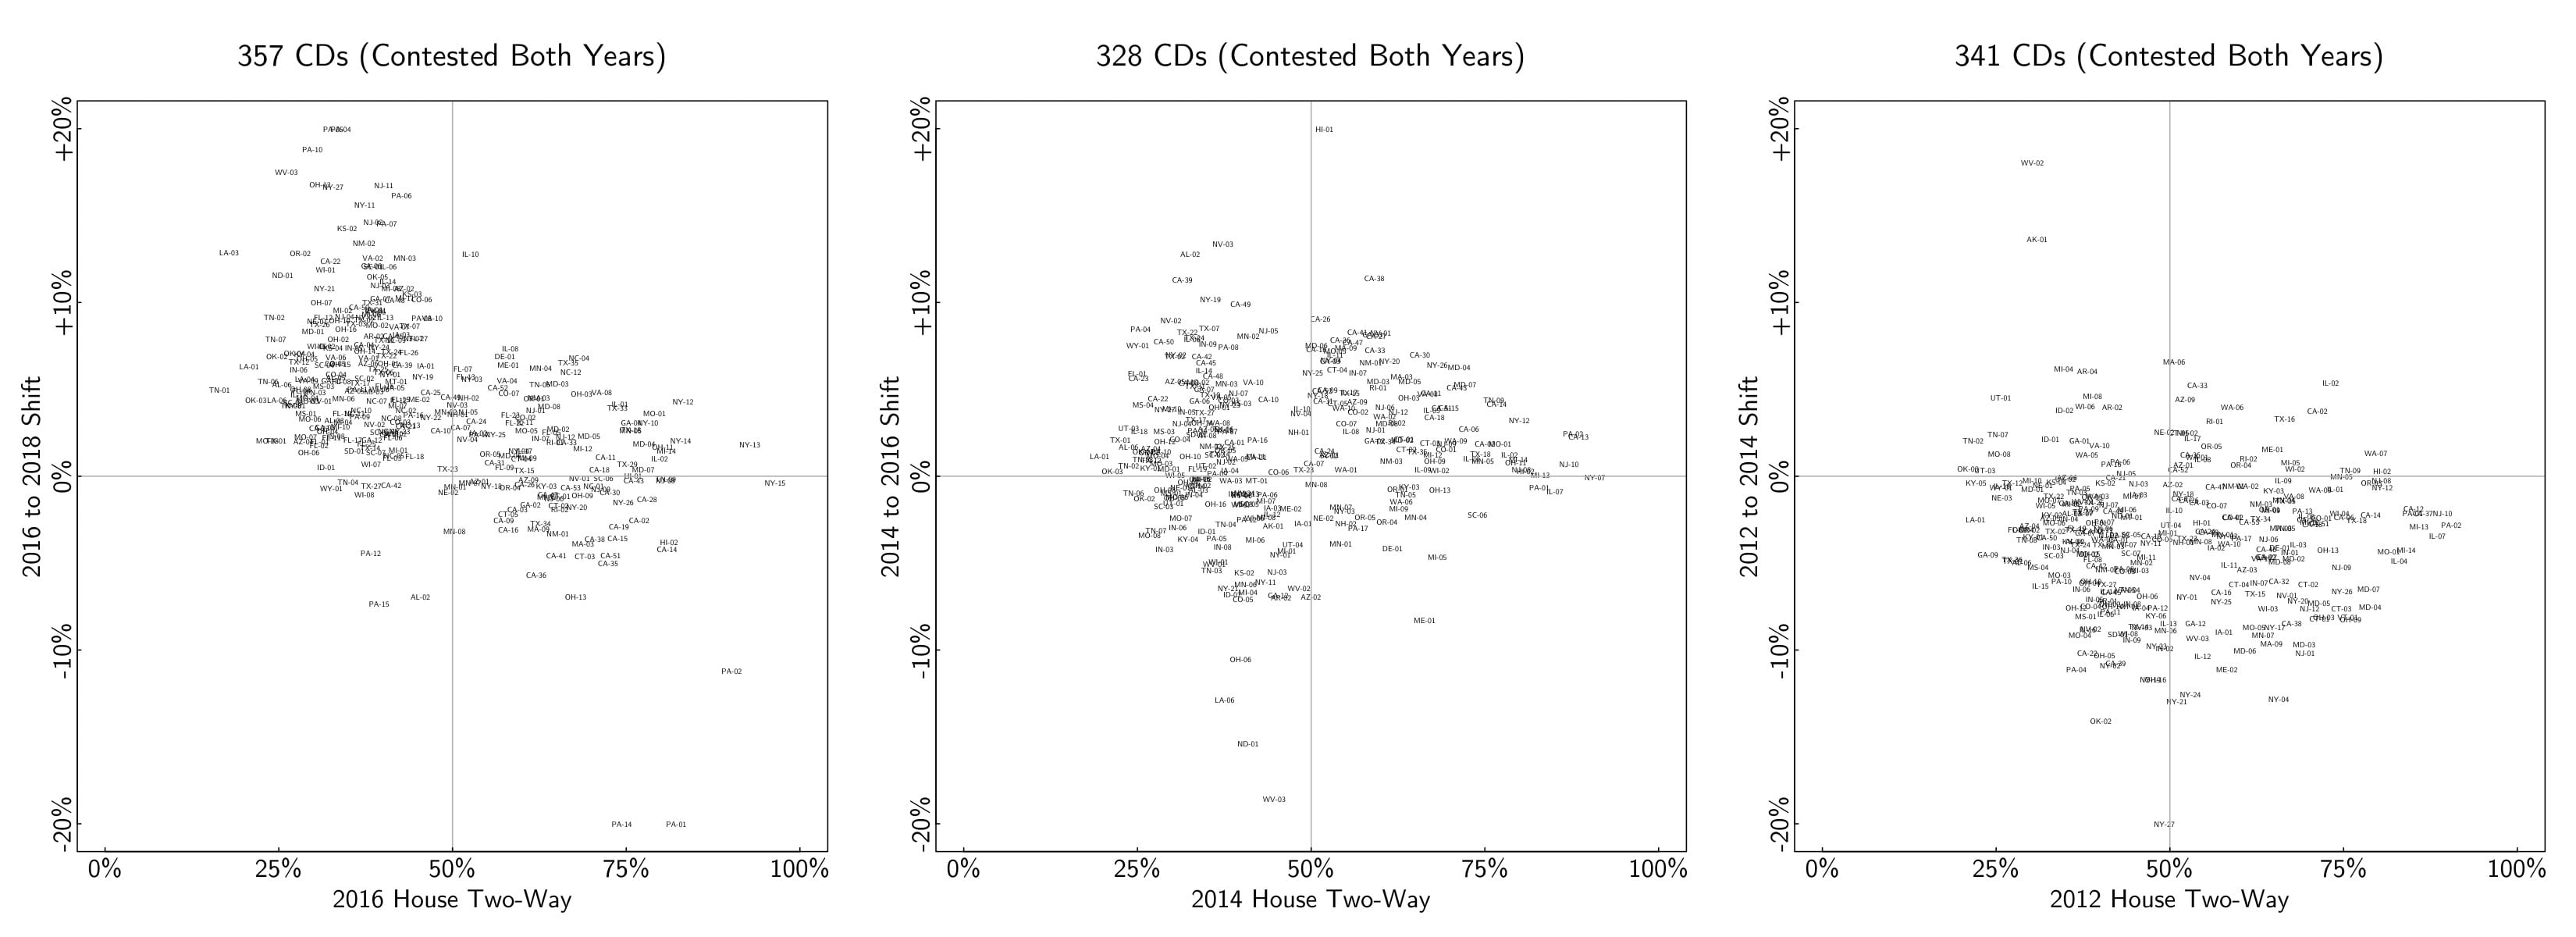
So the answer is: No, it’s not regression to the mean, it’s not a statistical artifact. The shift from 2016 to 2018—the Democrats gaining strength in Republican strongholds—is real. And it can have implications for statewide and presidential elections as well. This is also consistent with results we saw in various special elections during the past two years.
The current narrative is wrong
As Yair puts it:
Current narrative: Dems did better in suburban/urban, Reps did better in rural, continuing trend from 2012-2016. I [Yair] am seeing the opposite:
This isn’t increasing polarization/sorting. This also isn’t mean-reversion. D areas stayed D, R areas jumped ship to a large degree. A lot of these are the rural areas that went the other way from 2012-2016.
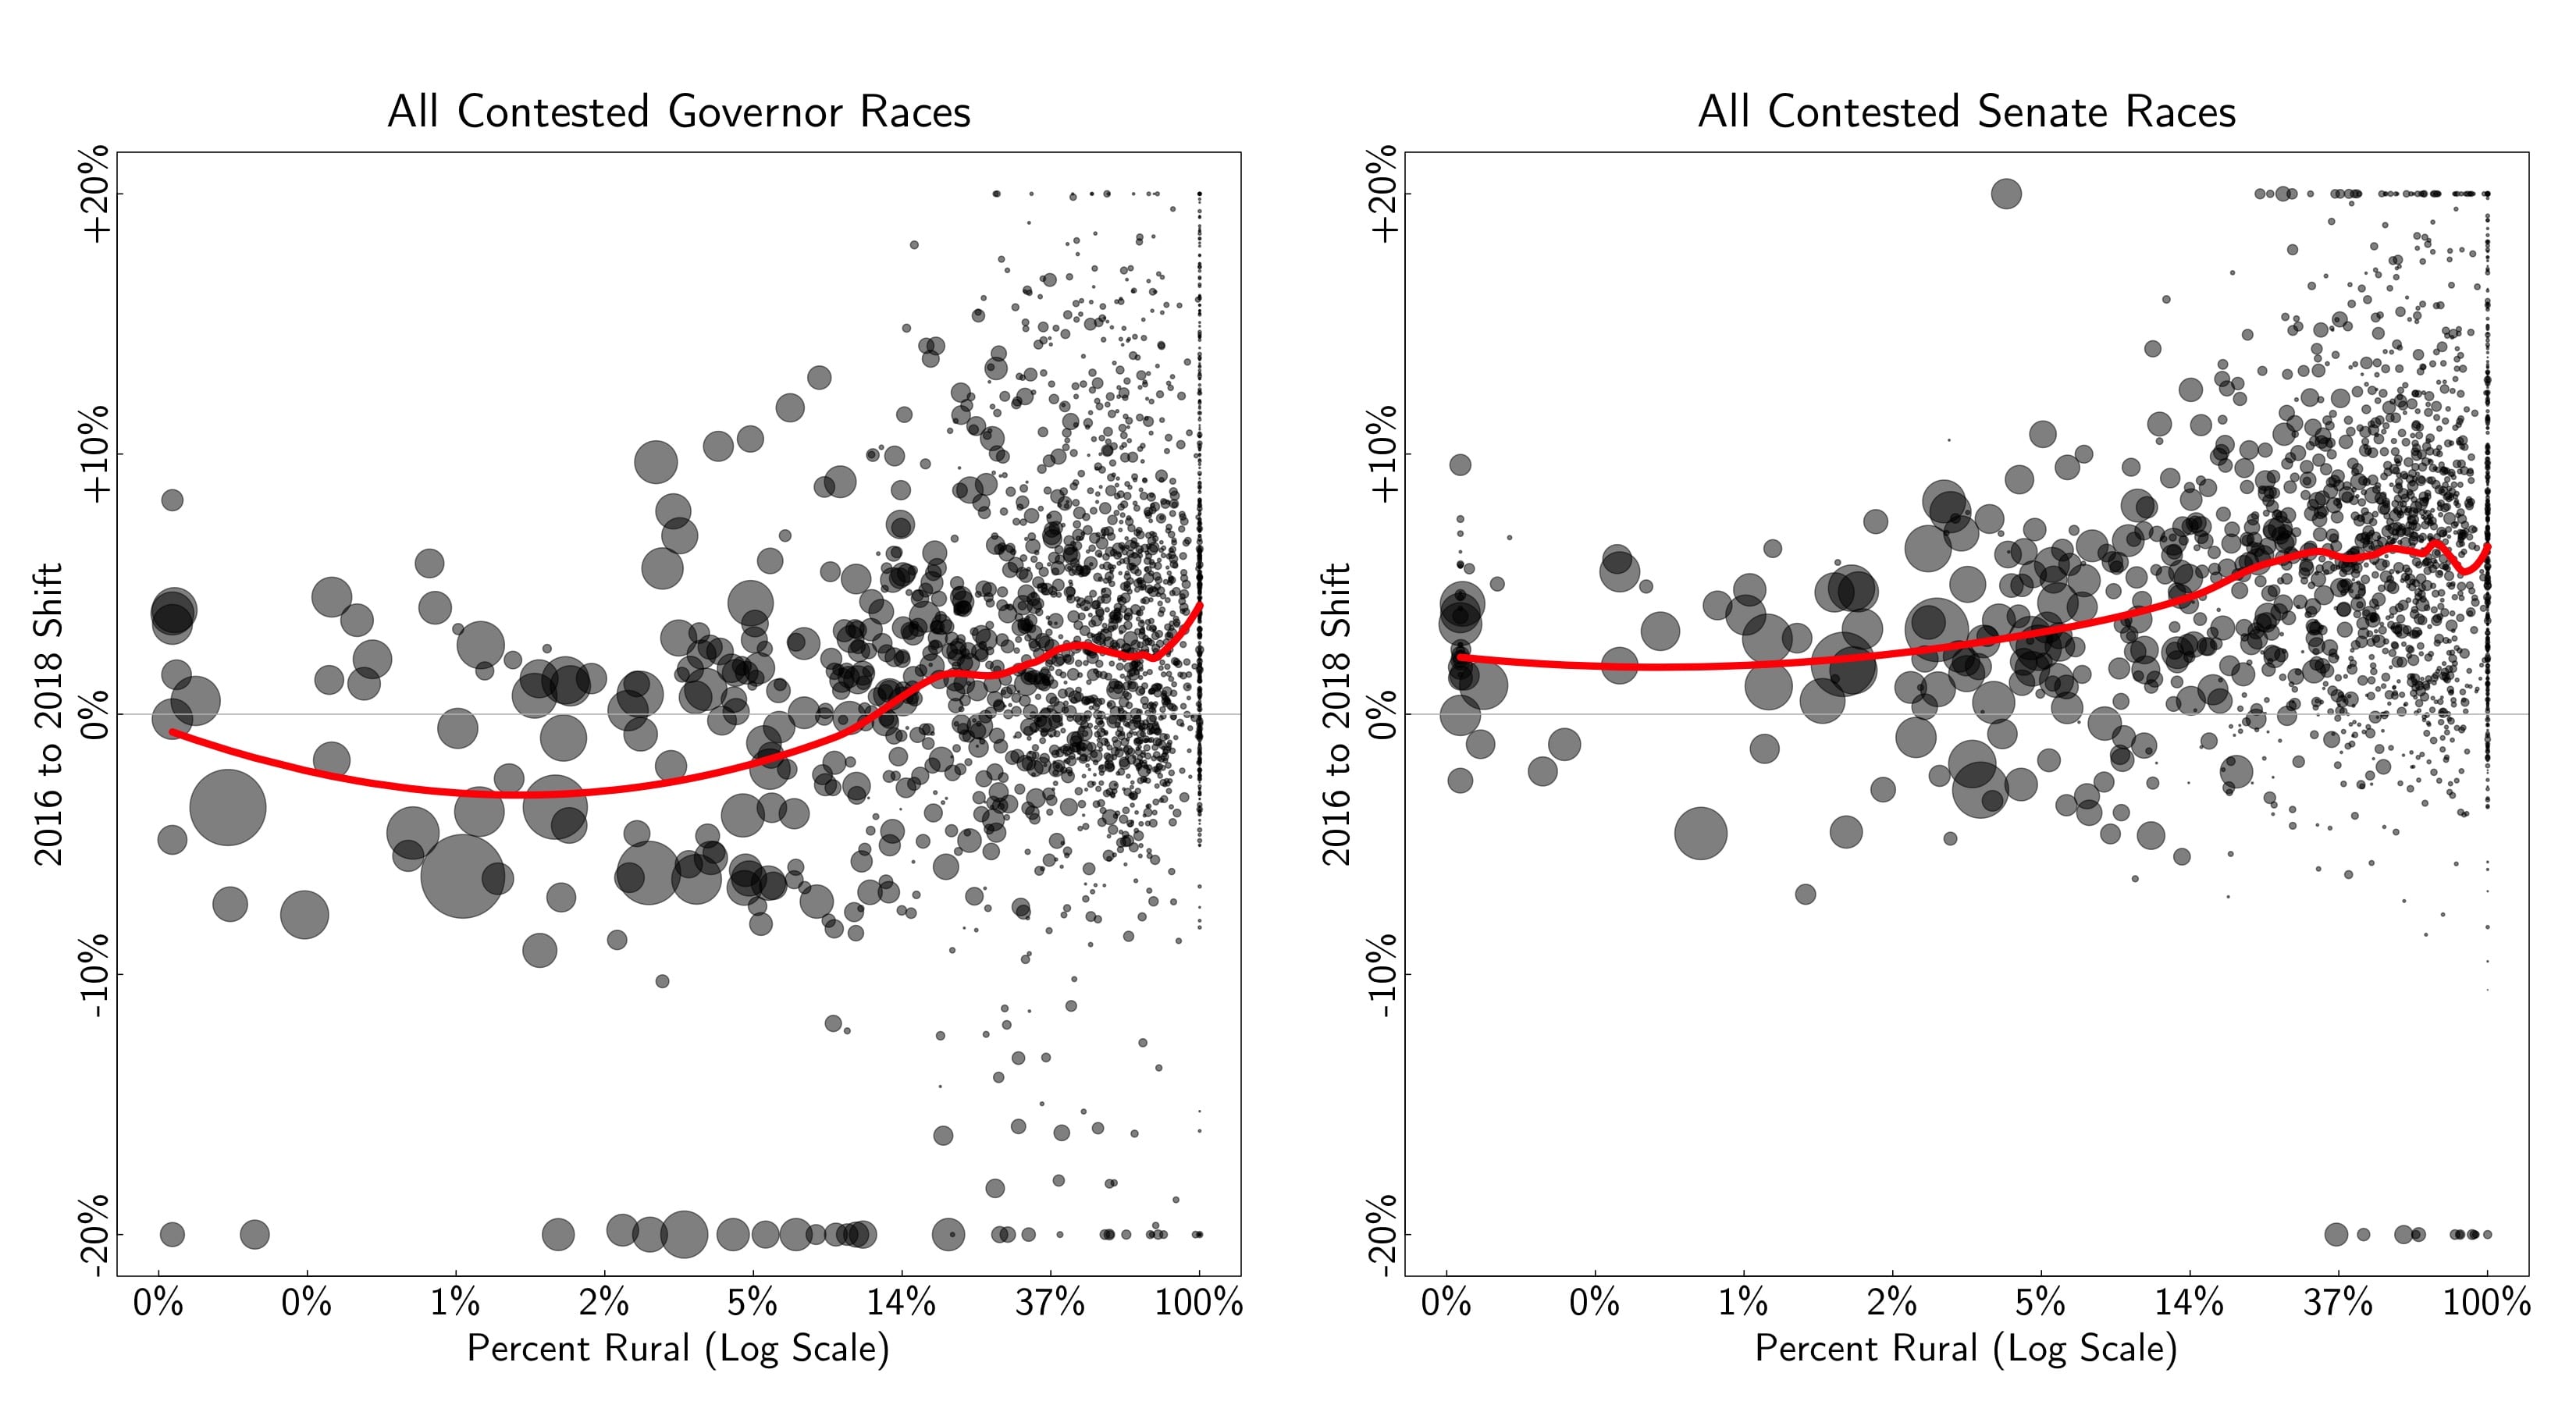
Not just in CD races, also in Gov and Senate races . . . Massive, 20+ point shift in margin in Trump counties. Remember this is with really high turnout. . . . This offsets the huge shift from 2012-2016, often in the famous “Obama-Trump” counties.

Yair adds:
The reason people are missing this story right now: focusing on who won/lost means they’re looking at places that went from just below 50 to just above 50. Obviously that’s more important for who actually governs. But this is the big public opinion shift.
I suspect that part of this could be strategy from both parties.
– On one side, the Democrats knew they had a problem in big swathes of the country and they made a special effort to run strong campaigns everywhere: part of this was good sense given their good showing in special elections, and part of it was an investment in their future, to lay out a strong Democratic brand in areas that where they’ll need to be competitive in future statewide and presidential elections.
– On the other side, the Republicans had their backs to the wall and so they focused their effort on the seats they needed to hold if they had a chance of maintaining their House majority.
From that standpoint, the swings above do not completely represent natural public opinion swings from national campaigns. But they are meaningful: they’re real votes, and they’re in places where the Democrats need to gain votes in the future.
There are also some policy implications: If Democratic challengers are more competitive in previously solid Republican districts, enough so that the Republican occupants of these seats are more afraid of losing centrist votes in future general elections than losing votes on the right in future primaries, this could motivate these Republicans to vote more moderately in congress. I don’t know, but it seems possible.
I sent the above to Yair, and he added the following comments:
1. One important nuance is that this is conditional on competitiveness. In the House, some have suggested that Clinton/Trump 2016 is a better baseline than House 2016 vote, because that was a competitive race and many of these places weren’t competitive at all in 2016. When you use President 2016 as a baseline, it’s true that it looks more like a uniform swing:
I don’t really buy this, though: (a) as has been widely reported, the Democrats’ explicit strategy was to broaden the map and try to run competitive candidates everywhere, because you never know which seats you’re gonna pick up. (b) Regardless of competitiveness, the fact remains that way more people in R areas voted for D’s this time. After nearly a decade of increasing polarization, many people saying there aren’t swing voters (which was always ridiculous), etc., this remains an important shift.
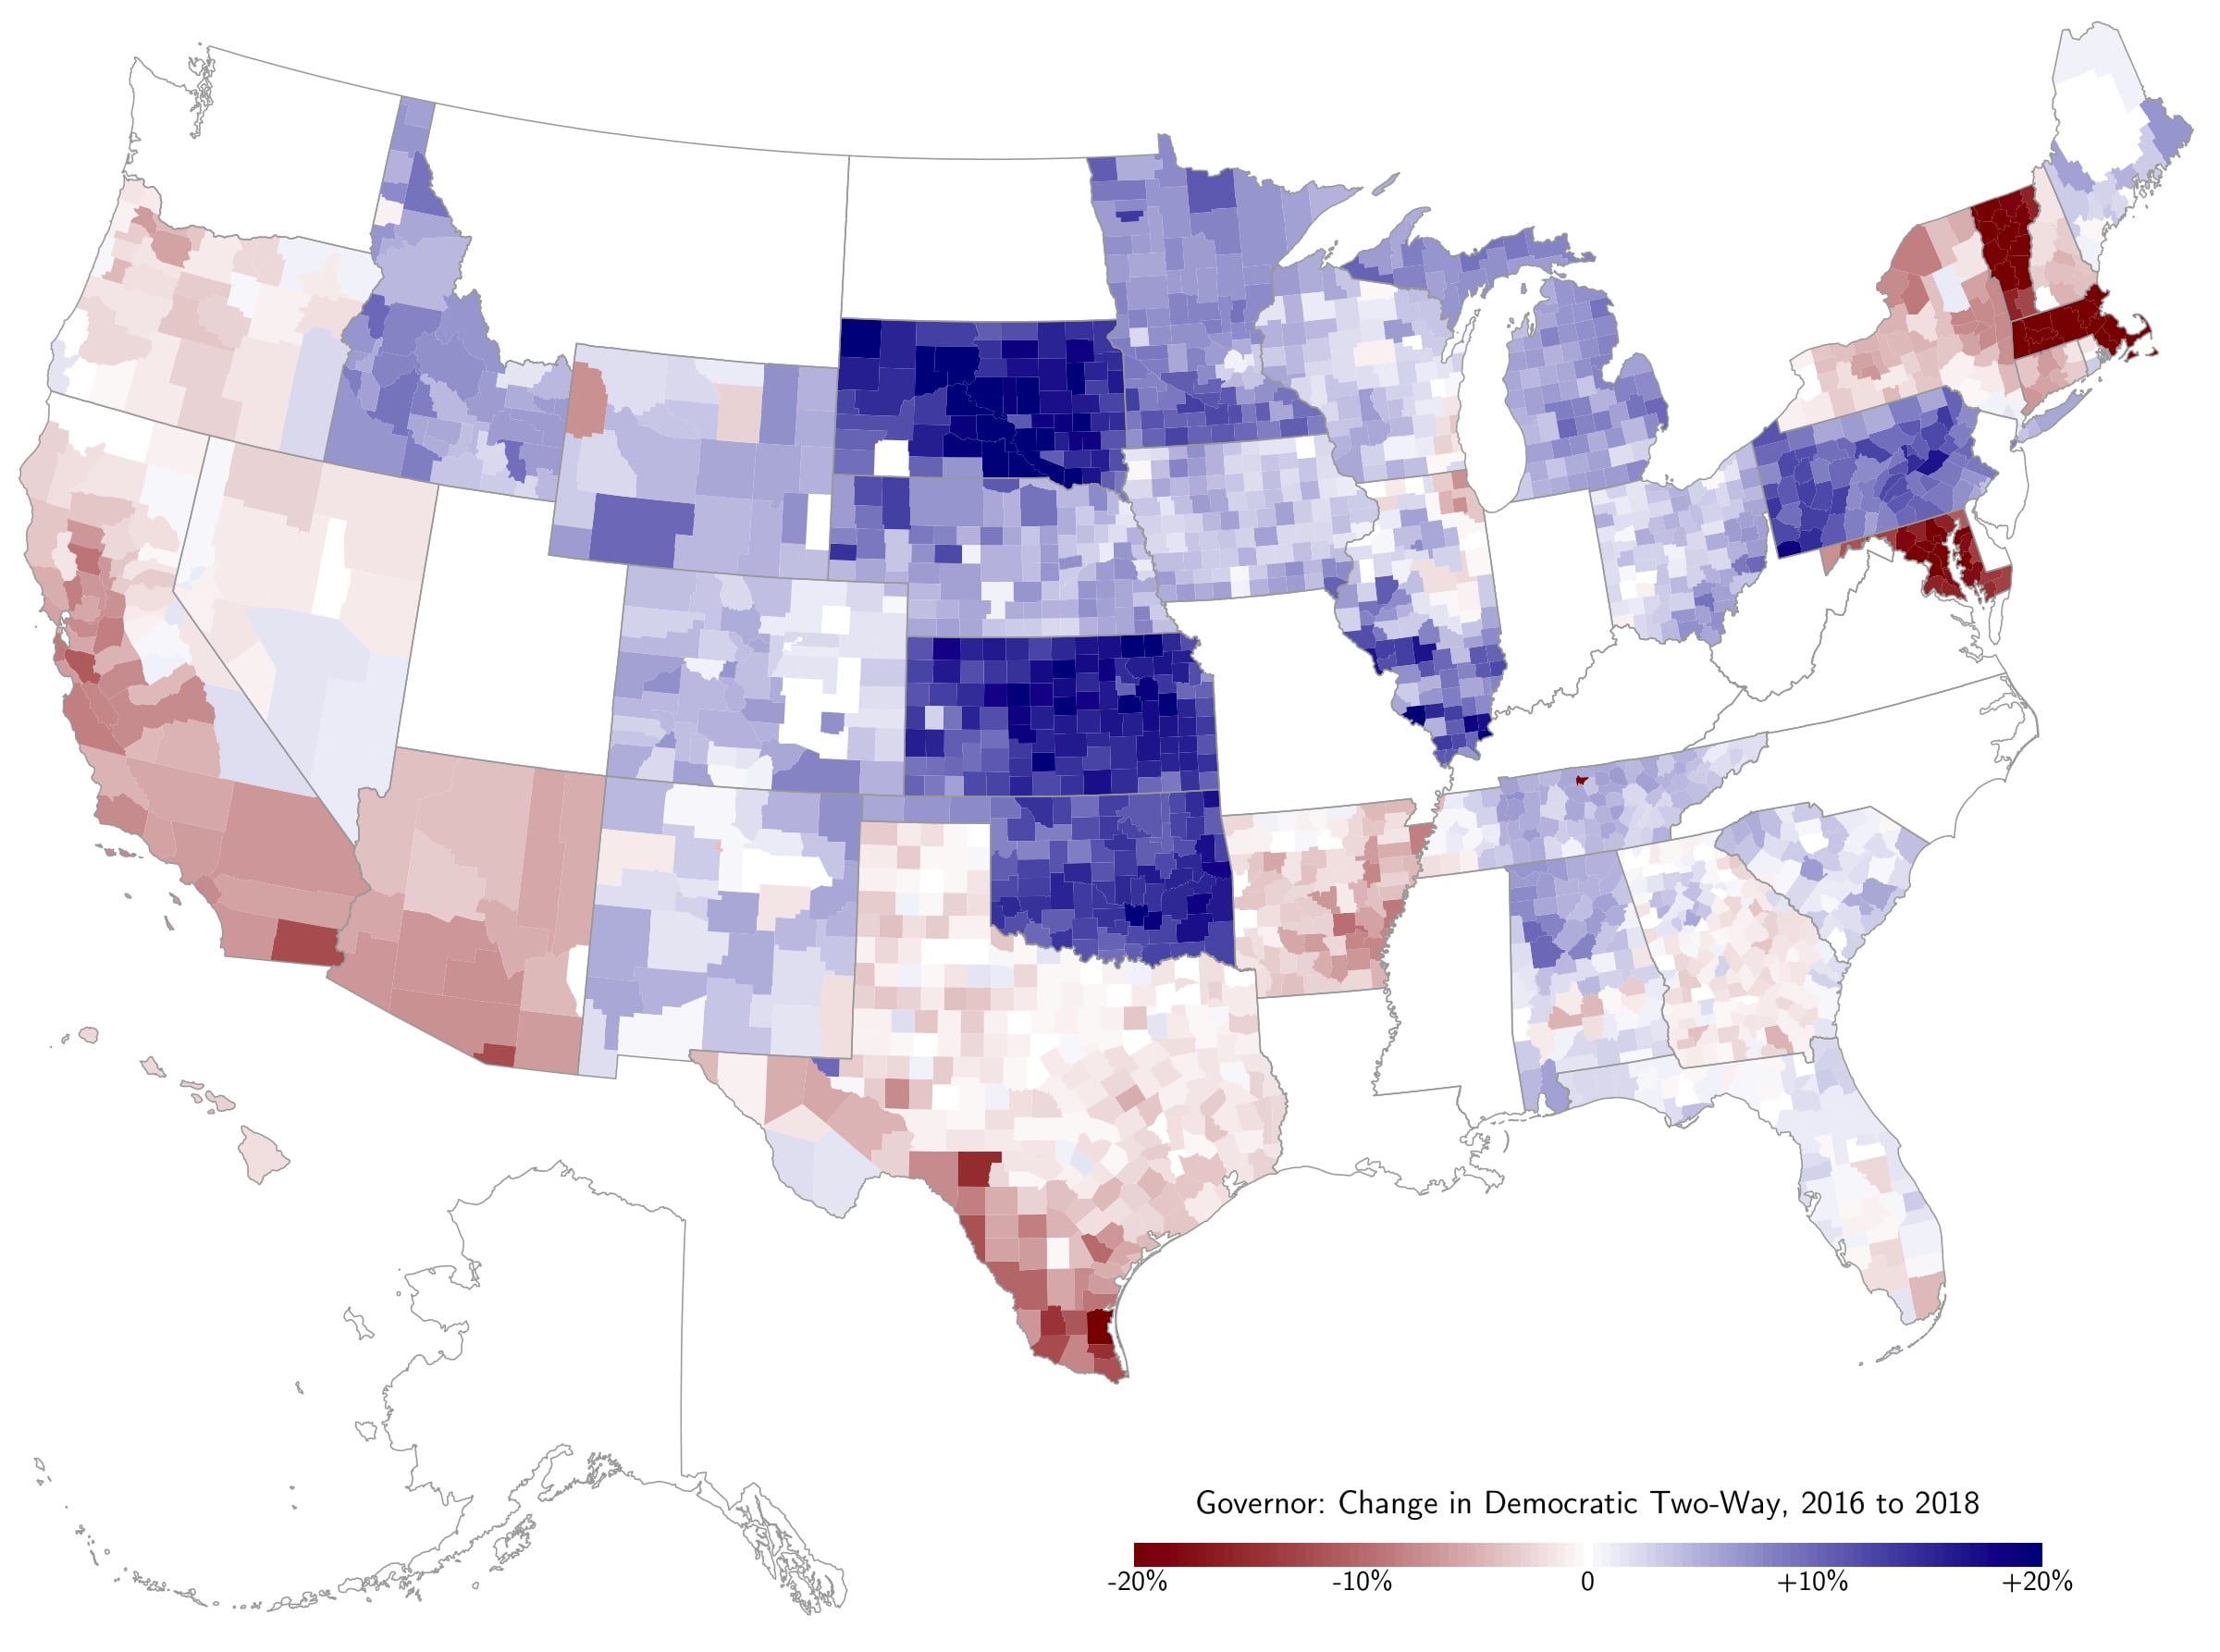
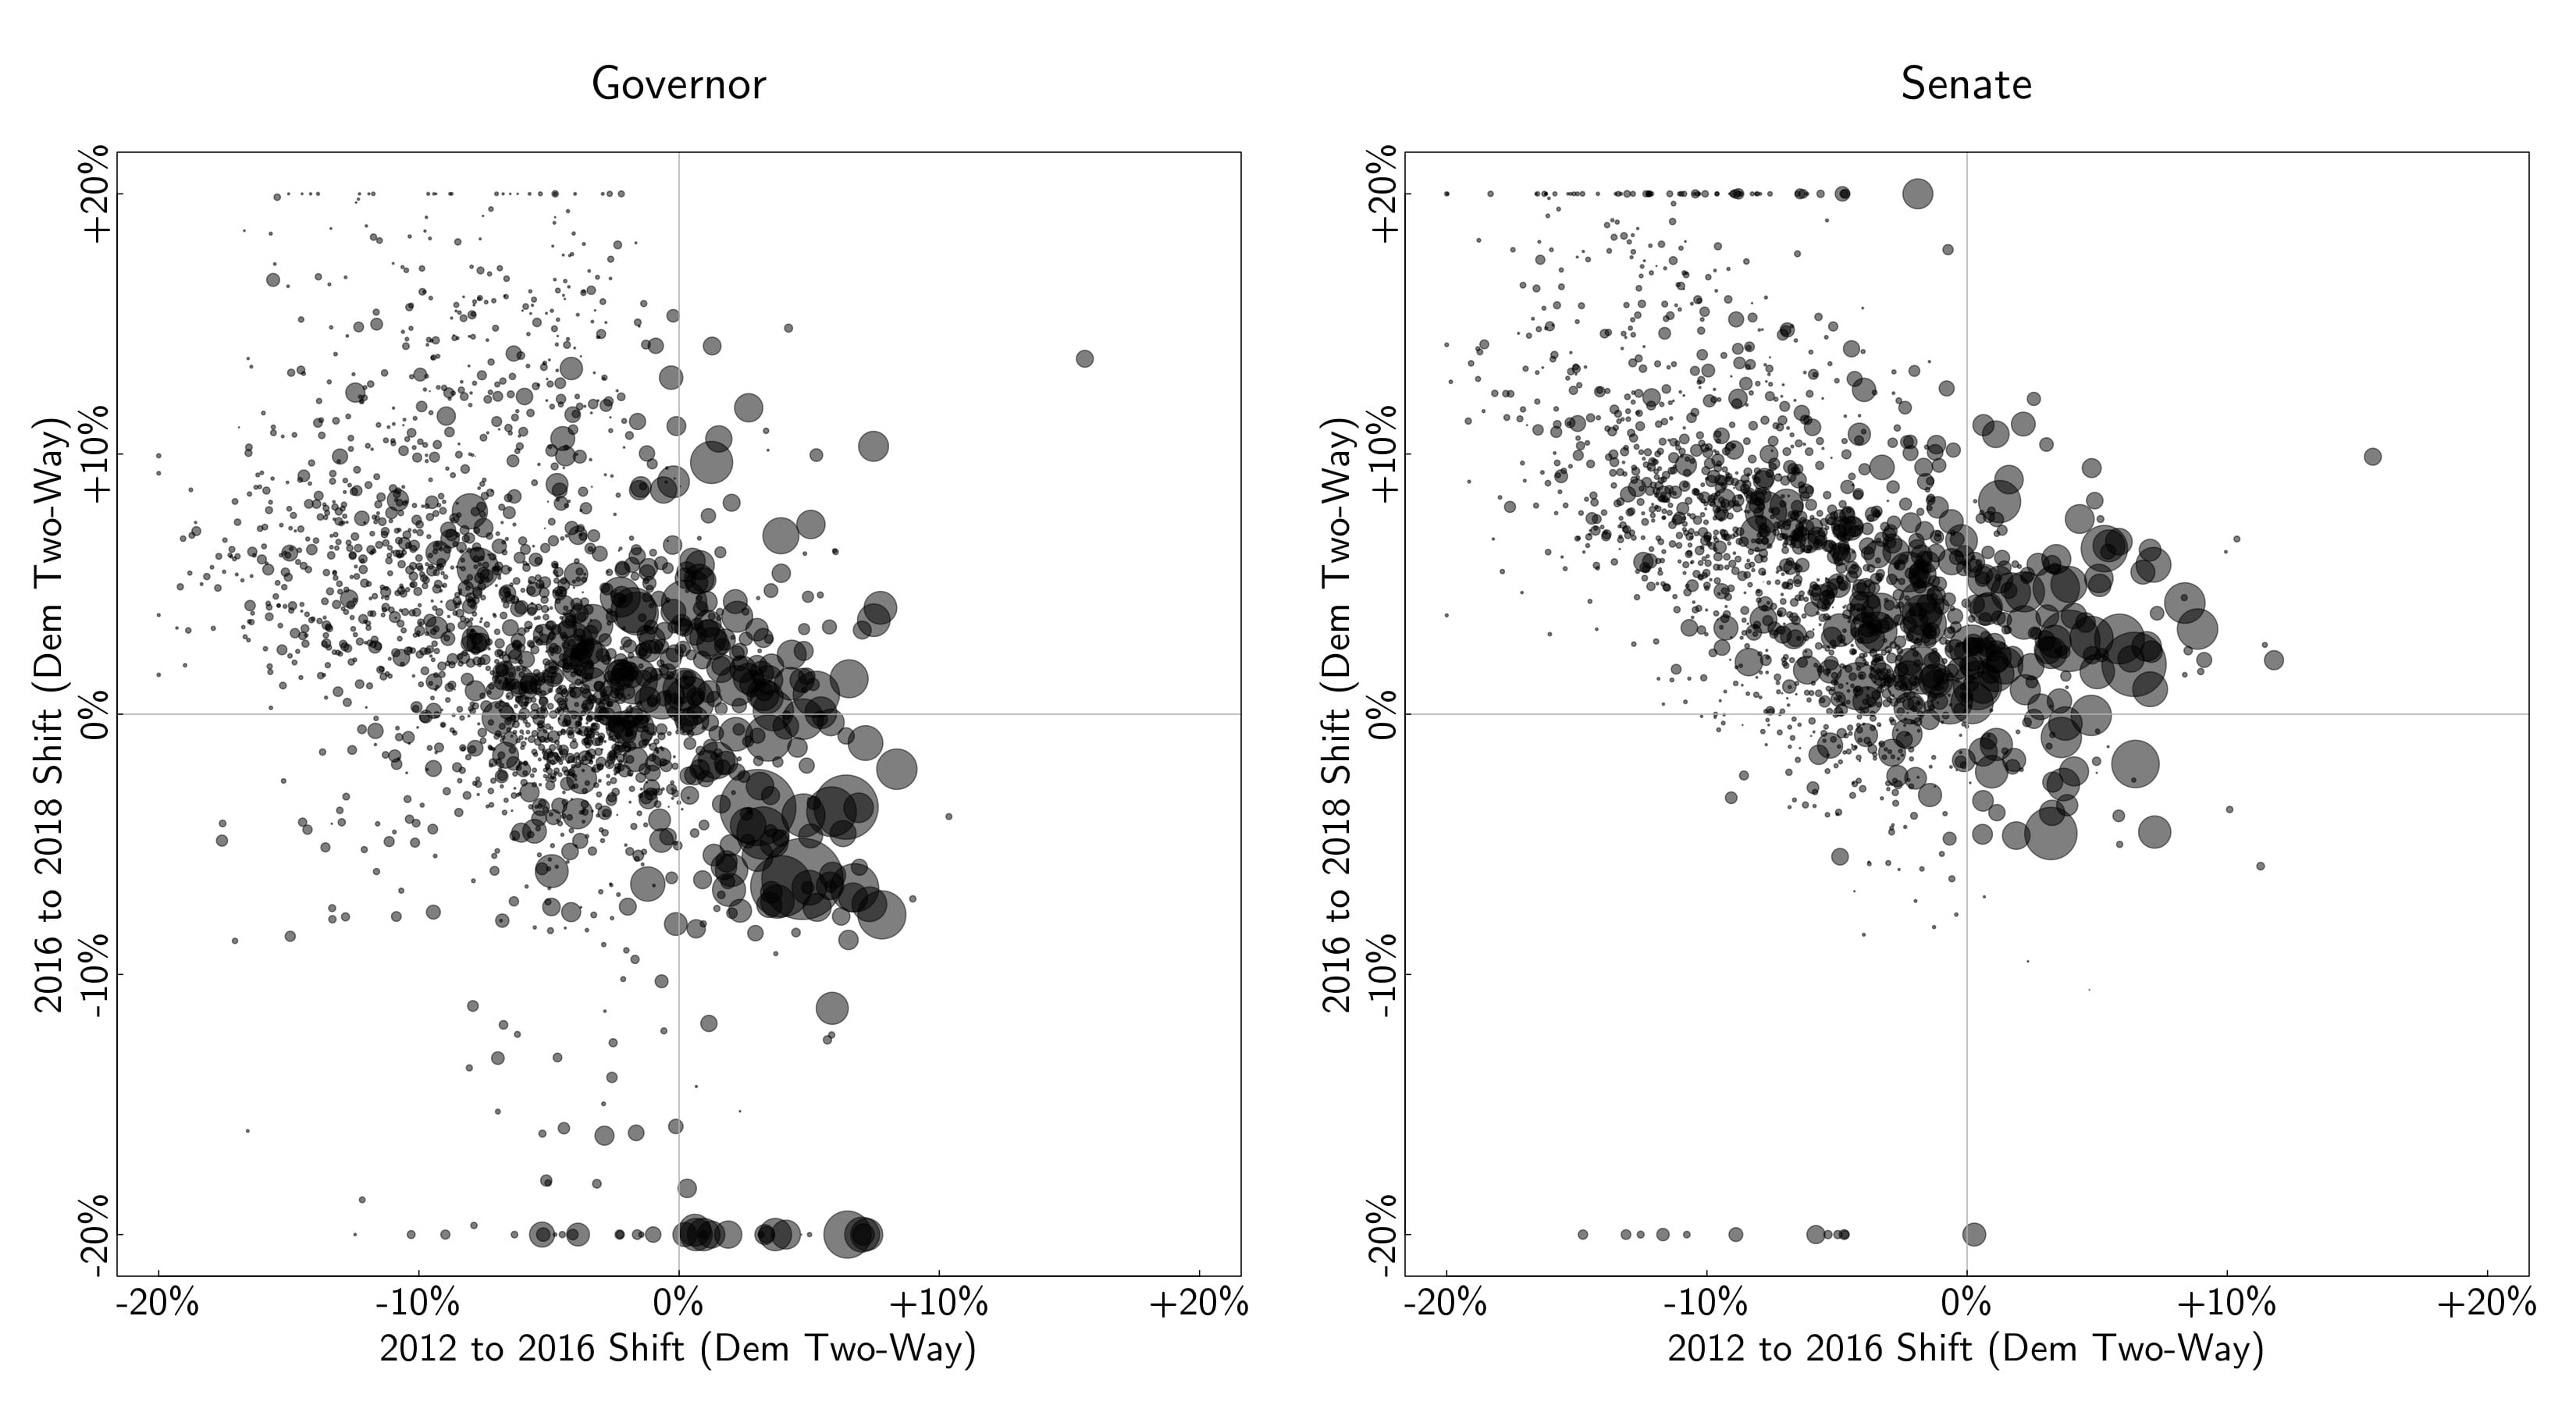
2. Related—in statewide races, the story is more complicated. Here are maps and plots of changes by county in the statewide races:
Much of the gain in R places was in non-competitive races, and some have commented that a lot of these places are always more moderate in statewide races. It’s not totally clear though, and this becomes a chicken-and-egg problem. A lot of the swing came in the Midwest, for example, in races that weren’t considered super-competitive in the end. But why not? Two years ago you might have thought that Sherrod Brown or Debbie Stabenow’s races in OH/MI could be up for grabs. They ended up being “not competitive” but maybe the causal arrow went: R defectors –> polling data shows a big lead –> people pull out. Frankly I don’t know the dynamics of all of these races well enough to say. But I do think it’s interesting that in some of the highest profile races, we did NOT see R defectors in the same way. I’m sure some will feel this means that, when push comes to shove and Rs put a lot of effort into a competitive campaign, we won’t necessarily see the same things.
3. Ceiling effects/wave dynamics—some people pointed out that you won’t see movement in Dem places in a Dem year because there’s nowhere to go. I don’t buy this. Reversion to the mean can be the expectation every time, and it hasn’t happened in a long time. In other words, I’m not sure where the ceiling is. Before the election, a scenario where the Democrats gained ground in urban areas and lost some in rural could have seemed perfectly plausible. Indeed that’s still the story being written to a large extent. I also do wonder whether familiarity with these statistical concepts (reversion to the mean, ceiling effects) makes smart people underestimate what happened on the ground—many Republicans in Republican areas voting for a Democrat for the first time in a long time. This is an important story as it goes against trends in increasing sorting/polarization.


P.S. I’ve added and updated some graphs.
Can we download this data somewhere? Would love to play a bit with the scatterplot at the top.
Good stuff! Is the data/code for the above available for the rest of us to play with?
Great stuff. Yair is providing an important counterpoint to the simple “more polarization” interpretation of 2018. On the other hand, there is plenty of evidence that some of the changes we saw in 2016 continued in this election, especially the growing partisan gap between white college and white non-college voters. And Yair’s finding that the swing is uniform when looking at 2016 Clinton-Trump vote seems to confirm that. My takeaway is there are a lot of moving parts here, and thinking of this in terms of “polarization: yes or no?” probably isn’t helpful.
The fact that the story changes so much when shifting from a benchmark of 2016 House to 2016 Pres suggests there was weaker correlation between the two votes in 2016 than we might assume (perhaps less than the historical norm?). So just to throw out a theory, perhaps there was a population of GOP and GOP-leaning voters in 2016 who couldn’t vote for Trump (Romney-Clinton voters) but who stuck with the GOP in their House vote. In districts with a lot of these voters, GOP House candidates did well in 2016. But what we saw this year was many of these voters bringing their House vote into alignment with their anti-Trump viewpoint by voting Democratic. (And to the extent there were comparable blue-collar Dems who voted for Trump but stuck with Dem House candidates in 2016, defection by some to GOP House candidates in 2018 would dampen Democratic gains in some 2016 Democratic-leaning CDs.)
On the mean reversion issue, I don’t know that Yair’s two charts quite close the deal. In 2016 there wasn’t a big swing, and in 2014 it was Republicans not Democrats making the big gains. The parties are not the same in terms of having districts with super-majority support that might approach a theoretical ceiling: in 2016, Republican House members won by an average margin of 33.5%, while Democrats won by an average of 41.5%. Democrats had far more districts where their candidate ran far ahead of Clinton than Republicans had districts where they outperformed Trump. So while I certainly agree that Democrats need to compete aggressively in Red-leaning states and districts, I don’t think we can rule out some mean-reversion in 2018.
We also have to consider the role of turnout. Yair’s data shows elevated turnout by white college voters and depressed turnout by non-college whites. So this could create improved Democratic performance in heavily white CDs (which tend to be Republican), even absent persuasion of Trump voters to vote Democratic this year.
Thanks, Guy, for raising the point about turnout. I would like to see more discussion of this.
On #3, ceiling effects: The Dem percentages in Urban and Urban/Suburban districts here (in both 2016 and 2018) sure look like hard ceilings…
https://www.businessinsider.com/midterm-election-gop-democrat-vote-urban-suburban-rural-us-2018-11
Which seem to largely explain the short bars on the right in the CityLab graph above.
??
I’m sort of confused by Florida on the map showing the swings. It seems dominated by big blue arrows, but the state didn’t shift much from Trump’s totals for the statewide races. I know mathematically there are ways for that to happen, but none of them seem intuitively likely to me, so what’s up with that?
I don’t think any of that included presidential votes. In 2016, Trump won Florida by 1.20%. The Republicans won 16 House seats, which were all by significant margins, and the Democrats won 11 House seats. Of the 2016 House, 2016 presidential, and 2018 House elections, these are the districts that did not vote the same way all three times or that Wikipedia did not have presidential results for:
8: Wikipedia doesn’t have the 2012 or 2016 presidential results.
12: Wikipedia doesn’t have the 2012 or 2016 presidential results.
15: Wikipedia doesn’t have any presidential results.
25: Wikipedia doesn’t have any presidential results.
26 and 27: These were easy wins for Obama and a Republican incumbent in 2016. These were the only two districts in Florida that changed parties in 2018. 26 had a Republican incumbent lose by 1.8%, and 27 had a Democrat win by 6.0% after the Republican incumbent retired.
Why is it not a statistical artifact? How should we interpret those graphs? isn’t it true that the 2018 results mirror (opposite) the 2014 shift, suggesting a reversion?
In 2018, Democrats gained in most districts, but still gained in a higher percentage of districts they got under 50% in 2016 (top left corner divided by left half) than in districts they got over 50% in 2016 (top right corner divided by right half). In 2016, Democrats gained in a majority of districts, but gained more in districts they got over 50% in 2014 (top right corner divided by top half) than in districts they got under 50% in 2014 (top left corner divided by left half). In 2014, Republicans gained. All the scatterplots are done with the highest change to Democrats on the top, so Republican gains were in the bottom half. It looks like Republicans were equally likely to gain in 2014 in districts they got over 50% in 2012 and in districts they got under 50% in 2012. If I had a count of how many districts there were in each corner, I would know more. To summarize in terms of the party than improved in that election:
2018: More likely to improve in districts lost the previous time
2016: Less likely to improve in districts won the previous time
2014: Equally likely to improve in districts won the previous time and districts lost the previous time
What happened in 2016 is what happened in a state level in votes for president. The highest population states that voted for Obama in 2012 and Clinton in 2016 were California, New York, and Illinois. Clinton improved on Obama’s margin in California and Illinois, and she did worse than Obama in New York. For the three states combined, she won by 25.33%, which improved on Obama’s win by 23.24%. Clinton lost Florida (a margin 2.08% worse than Obama’s in 2012), Ohio (a margin 11.11% worse than Obama’s in 2012), and Pennsylvania (a margin 6.11% worse than Obama’s in 2012). In the low population swing state of Iowa, Clinton’s margin was 12.22% worse than Obama’s in 2012.
The independent variable is percentage two years earlier, and the dependent variable is change, so this is done by comparing a corner to the left or right half it is in, not comparing a corner to the top or bottom half it is in.
Your point about whether we improved more in the suburbs or elsewhere is confirmed by changes in the exit poll data. Comparing 2018 House exit to 2016 House exit, the Dem margin improved a net 10 points in urban areas, a net 8 points in suburban areas, and a net 14 points in rural areas.